. 2012 Dec 15;21(26):5484-99.
doi: 10.1093/hmg/dds393. Epub 2012 Sep 21.

An inherited TUBB2B mutation alters a kinesin-binding site and causes polymicrogyria, CFEOM and axon dysinnervation

Affiliations

An inherited TUBB2B mutation alters a kinesin-binding site and causes polymicrogyria, CFEOM and axon dysinnervation

Gustav Y Cederquist et al. Hum Mol Genet. .

Abstract

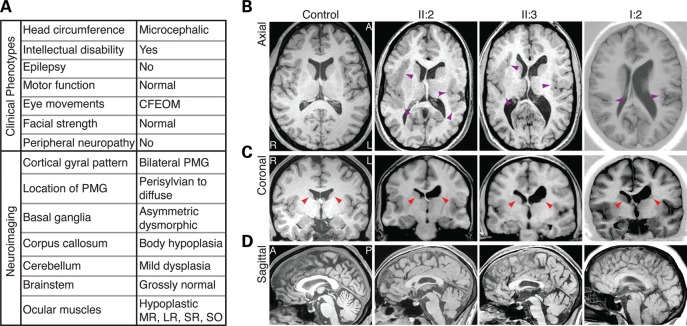
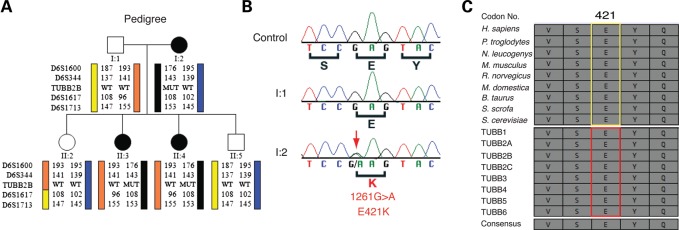
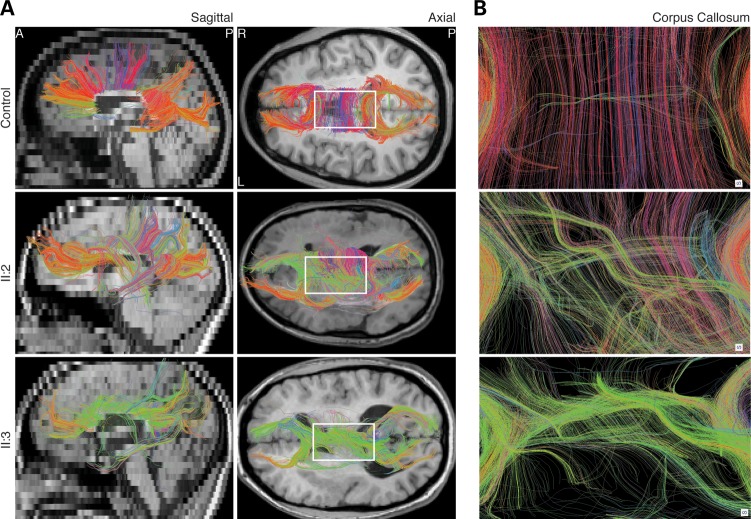
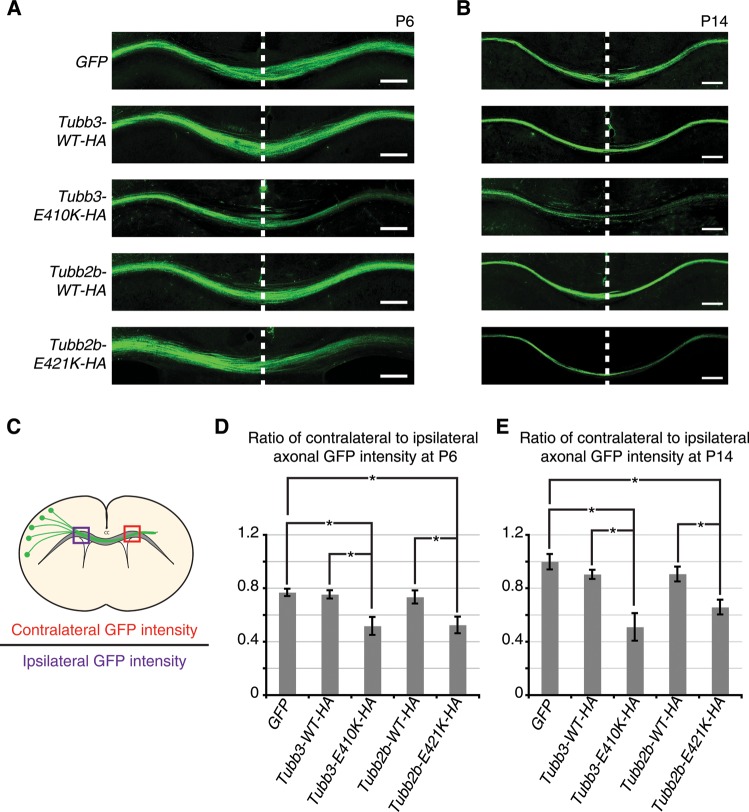
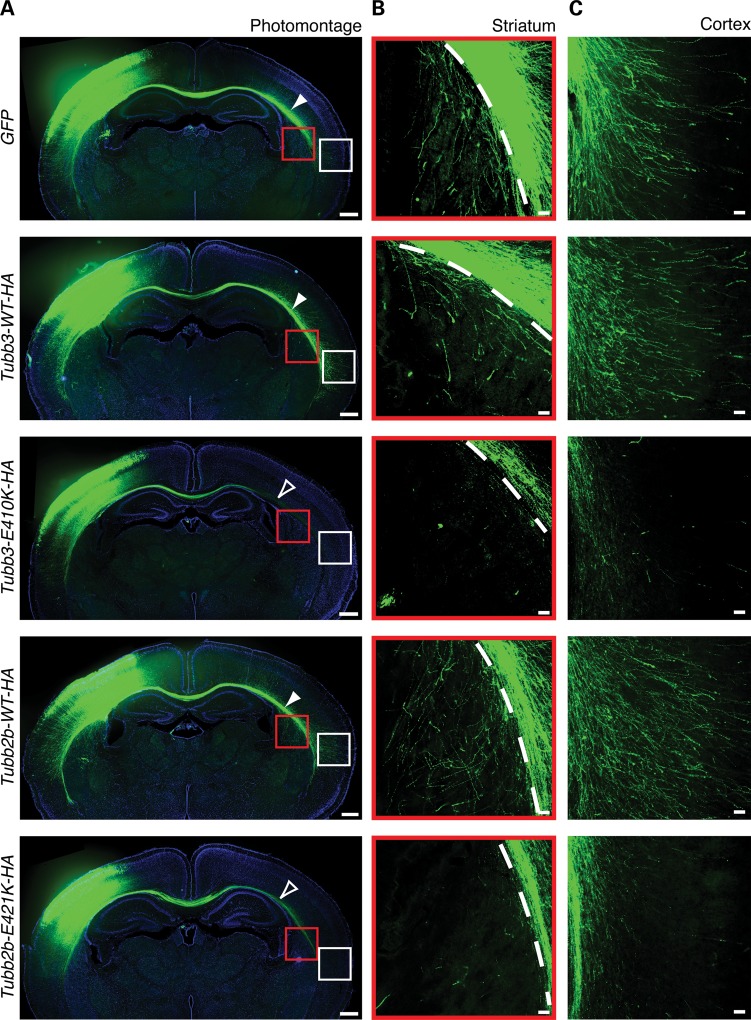
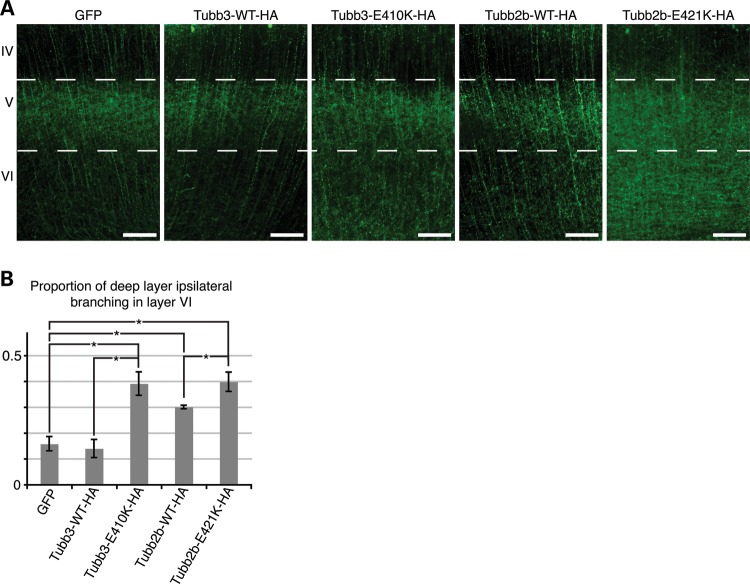
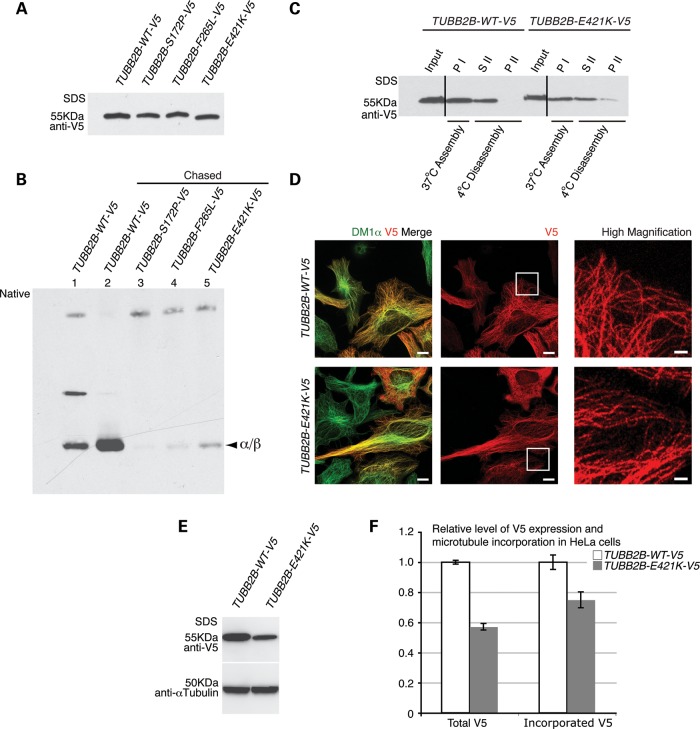
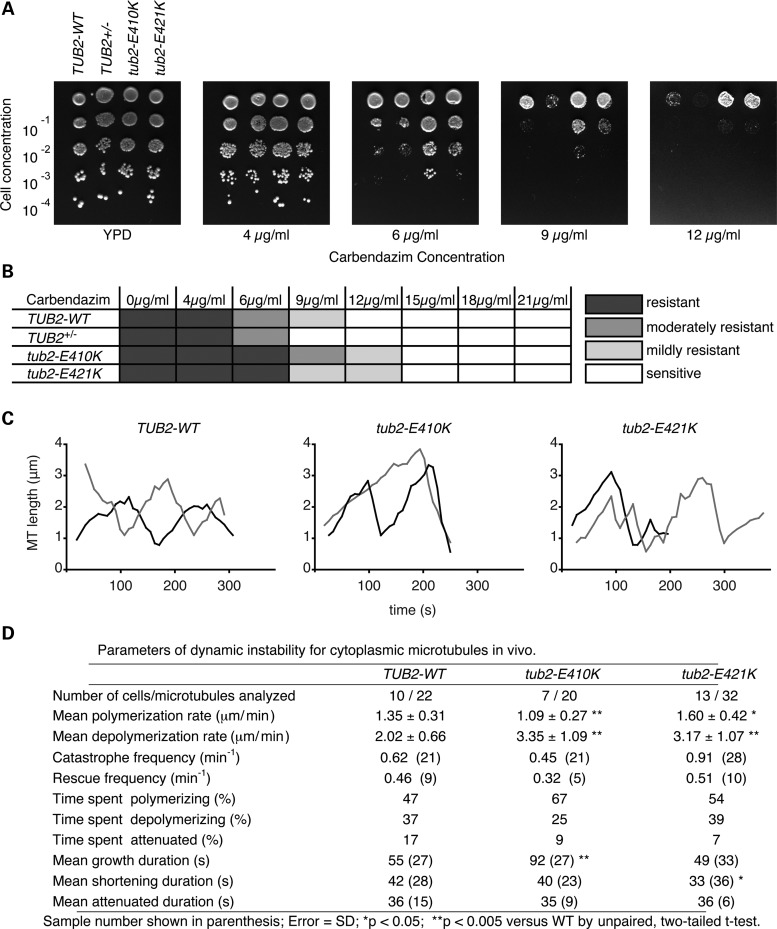
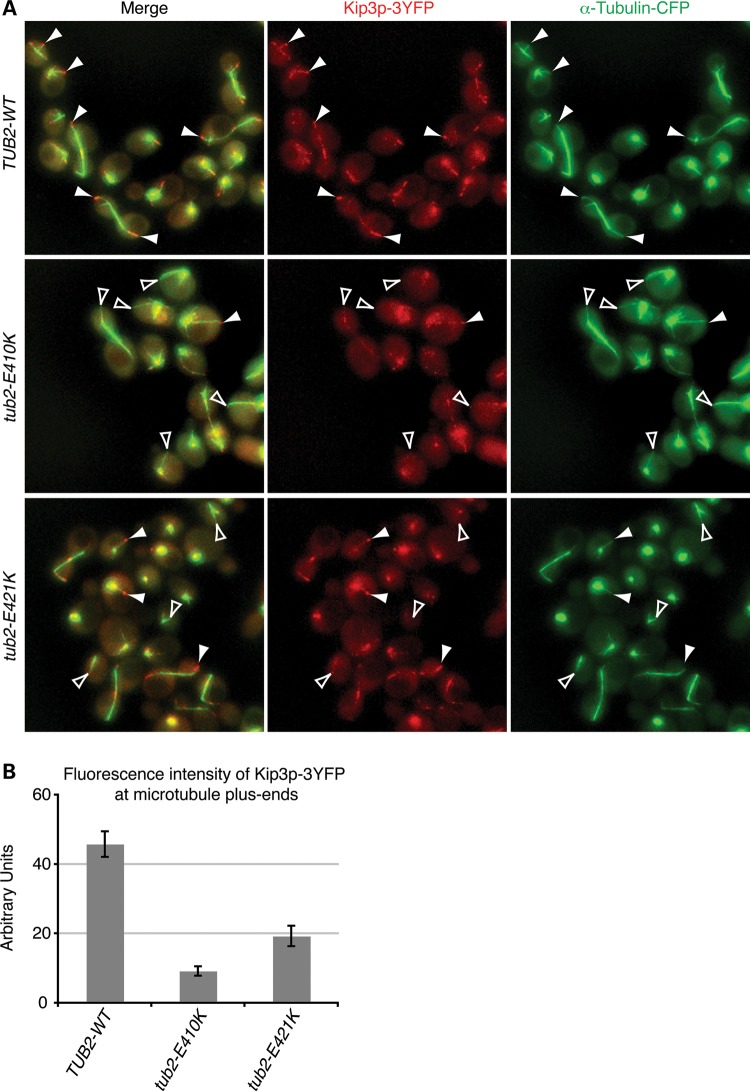
Microtubules are essential components of axon guidance machinery. Among β-tubulin mutations, only those in TUBB3 have been shown to cause primary errors in axon guidance. All identified mutations in TUBB2B result in polymicrogyria, but it remains unclear whether TUBB2B mutations can cause axon dysinnervation as a primary phenotype. We have identified a novel inherited heterozygous missense mutation in TUBB2B that results in an E421K amino acid substitution in a family who segregates congenital fibrosis of the extraocular muscles (CFEOM) with polymicrogyria. Diffusion tensor imaging of brains of affected family members reveals aberrations in the trajectories of commissural projection neurons, implying a paucity of homotopic connections. These observations led us to ask whether axon dysinnervation is a primary phenotype, and why the E421K, but not other, TUBB2B substitutions cause CFEOM. Expression of exogenous Tubb2b-E421K in developing callosal projection neurons is sufficient to perturb homotopic connectivity, without affecting neuronal production or migration. Using in vitro biochemical assays and yeast genetics, we find that TUBB2B-E421K αβ-heterodimers are incorporated into the microtubule network where they alter microtubule dynamics and can reduce kinesin localization. These data provide evidence that TUBB2B mutations can cause primary axon dysinnervation. Interestingly, by incorporating into microtubules and altering their dynamic properties, the E421K substitution behaves differently than previously identified TUBB2B substitutions, providing mechanistic insight into the divergence between resulting phenotypes. Together with previous studies, these findings highlight that β-tubulin isotypes function in both conserved and divergent ways to support proper human nervous system development.


Figures

Figure 1.
Figure 1.
A genetically undefined syndrome characterized by CFEOM and intellectual disability. (A) Chart summarizing clinical and neuroradiological findings of affected family members. (B) Axial views show the extent of PMG in patients. PMG is diffuse and bilateral in II:2 and II:3 and primarily perisylvian in I:2 (purple arrowheads). (B and C) Axial and coronal views show basal ganglia dysmorphisms. There is marked dysplasia of the left caudate head, and a poorly defined putamen when compared with the right (red arrowheads). In addition, there are asymmetric white matter tract abnormalities, with poor fasciculation of the left internal capsule and left ventricular dilation. (D) Sagittal views show thinning of the CC body, whereas the genu is comparably less hypoplastic. I:2 (affected mother), II:2 (affected older daughter) and II:3 (affected younger daughter) refer to pedigree positions in Figure 2. CFEOM, congenital fibrosis of the extraocular muscles; PMG, polymicrogyria; MR, medial rectus; LR, lateral rectus; SR, superior rectus; SO, superior oblique; L, left hemisphere; R, right hemisphere; A, anterior; P, posterior.
Figure 2.
Figure 2.
Heterozygous TUBB2B 1261G>A mutation (E421K) segregates with CFEOM and PMG. (A) Schematic of pedigree and targeted linkage analysis on chromosome 6 identifies a haplotype flanking the TUBB2B locus that segregates with the disease with complete penetrance. Pedigree members are denoted by circles (females) and squares (males) and by generation and position. Solid shapes indicate clinically affected individuals. ‘MUT’ indicates presence of the TUBB2B mutation, whereas ‘WT’ indicates the wild-type TUBB2B allele. (B) Targeted sequencing of TUBB2B coding exons and splice sites reveals a 1261G>A (E421K) heterozygous missense mutation (red arrow) that is found in all affected and not in unaffected individuals from the pedigree. (C) The E421 residue is strictly conserved across eukaryotic Tubb2b homologues (top, yellow box) and human β-tubulin isotypes (bottom, red box).
Figure 3.
Figure 3.
Abnormal homotopic connectivity associated with TUBB2B-E421K. Human DTI images segmenting commissural fibers of the CC. (A) Sagittal and axial views show that TUBB2B-E421K patients have a paucity of commissural fibers in the CC body, consistent with structural MRI findings. Furthermore, while many fibers in the healthy control are reconstructed with red color, many commissural fibers in TUBB2B-E421K patients are colored green, indicating a lack of normal homotopic connectivity. (B) Zoom in of the boxed region in (A) confirms that homotopic connectivity is disrupted in patients. CC, corpus callosum. Color coding: red, left–right; green, anterior–posterior; blue, superior–inferior.
Figure 4.
Figure 4.
Tubb2b-E421K-HA perturbs homotopic connectivity at the cortical midline. Fluorescent micrographs and quantification of axonal GFP intensity in the corpus callosum of electroporated mouse brains. (A and B) At P6 and P14, axonal GFP intensity is reduced in the contralateral hemisphere of brains electroporated with Tubb3-E410K-HA and Tubb2b-E421K-HA compared with GFP and WT controls. (C) Schematic describes quantification method. (D and E) Quantification confirms observations of reduced contralateral GFP intensity. (D) At P6, GFP = 0.77 ± 0.05, Tubb3-WT-HA = 0.73 ± 0.04, Tubb3-E410K-HA = 0.52 ± 0.14 (P < 0.05 compared to GFP and Tubb3-WT-HA), Tubb2b-WT-HA = 0.75 ± 0.10, Tubb2b-E421K-HA = 0.52 ± 0.11 (P < 0.05 compared GFP and Tubb2b-WT-HA). (E) At P14, GFP = 1.00 ± 0.08, Tubb3-WT-HA = 0.90 ± 0.06, Tubb3-E410K-HA = 0.51 ± 0.18 (P < 0.01 compared with GFP, and P < 0.05 compared with Tubb3-WT-HA), Tubb2b-WT-HA = 0.90 ± 0.10, Tubb2b-E421K-HA = 0.66 ± 0.08 (P < 0.05 compared with GFP and Tubb2b-WT-HA). For P6 and P14, n = 4,3 (GFP), n = 3,4 (Tubb3-WT-HA), n = 5,4 (Tubb3-E410K-HA), n = 5,3 (Tubb2b-WT-HA), n = 4,4 (Tubb2b-E421K-HA). Each N represents one embryo. One-way ANOVA with a post hoc Tukey t-test was used for multiple comparisons. CC, corpus callosum. Error bars represent SEM. *P < 0.05. Scale bars: 200 µm.
Figure 5.
Figure 5.
Tubb2b-E421K-HA perturbs CPN terminal axon extension. Fluorescent micrographs of mouse CPN electroporated at E15.5 and analyzed at P6. (A) Photomontage of coronal sections at P6 shows distal thinning of CPN fibers in brains electroporated with Tubb3-E410K-HA and Tubb2b-E421K-HA (open white arrowheads) compared with GFP and WT controls (solid white arrowheads). Some mutant axons do reach the most lateral region of the CC. (B and C) High magnification microscopy shows that CPN expressing GFP, Tubb3-WT-HA or Tubb2b-WT-HA send interstitial branches into the contralateral striatum (B, red boxes from A) and contralateral neocortex (C, white boxes from A), whereas CPN expressing Tubb3-E410K-HA and Tubb2b-E421K-HA fail to do so. n = 4 (GFP), n = 3 (Tubb3-WT-HA), n = 6 (Tubb3-E410K-HA), n = 5 (Tubb2b-WT-HA), n = 5 (Tubb2b-E421K-HA). Each n represents one embryo. CPN, callosal projection neurons; CC, corpus callosum. Scale bars: 400 µm (A), 50 µm (B and C).
Figure 6.
Figure 6.
Tubb2b-E421K-HA alters the layer specificity of local branching. Fluorescent micrographs of CPN electroporated at E15.5 and analyzed at P6. (A) Axons of CPN expressing GFP, Tubb3-WT-HA, or Tubb2b-WT-HA have sent dense interstitial branches into layer V of the ipsilateral cortex, but few branches into the deeper layer VI. In contrast, axons of CPN expressing Tubb3-E410K-HA and Tubb2b-E421K-HA do not show similar specificity as a high density of branching is seen in layer VI, in addition to layer V. (B) Quantitative analysis of the fluorescence intensity in the deep layers (V and VI) reveals that 0.16 ± 0.03 of GFP, 0.14 ± 0.04 of Tubb3-WT-HA and 0.30 ± 0.01 of Tubb2b-WT-HA branches target layer VI. Tubb2b-WT-HA electroporation significantly increases the proportion of layer VI branching (P < 0.01 compared with GFP). There is, however, also a significant increase in the proportion of branching in layer VI in both mutant conditions, with 0.39 ± 0.05 of Tubb3-E410K-HA (P < 0.01 compared to Tubb3-WT-HA control) and 0.40 ± 0.04 of Tubb2b-E421K-HA (P < 0.05 compared with Tubb2b-WT-HA control) branching in layer VI. n = 4 (GFP), n = 3 (Tubb3-WT-HA), n = 3 (Tubb3-E410K-HA), n = 5 (Tubb2b-WT-HA), n = 4 (Tubb2b-E421K-HA). Each n represents one embryo. One-way ANOVA with the post hoc Tukey t-test was used for multiple comparisons. IV, neocortical layer IV; V, neocortical layer V; VI, neocortical layer VI. Error bars represent SEM. *P < 0.05. Scale bars: 100 µm.
Figure 7.
Figure 7.
The E421K substitution decreases the efficiency of αβ-heterodimer formation, but permits incorporation into microtubule polymers. TUBB2B-E421K-V5 αβ-heterodimer formation and incorporation were assayed by in vitro transcription and translation using rabbit reticulocyte lysates and in vivo by HeLa cell transfection. (A) WT and mutant TUBB2B-V5 plasmids show equivalent polypeptide production in vitro after DNA adjustment. (B) In vitro formation of WT and mutant TUBB2B αβ-heterodimers analyzed by native gel electrophoresis. Chasing the reaction with purified porcine tubulin releases newly synthesized subunits from folding machinery (compare α/β bands from lane 2 to lane 1). The E421K substitution leads to decreased αβ-heterodimer formation (lane 5) compared with WT (lane 2), and greater formation than S172P (lane 3) and F265L (lane 4). (C) In vitro microtubule polymerization of porcine brain tubulin and V5-tagged heterodimers. WT and E421K TUBB2B αβ-heterodimers co-polymerize with brain tubulin at comparable efficiencies. Microtubules containing WT and E421K αβ-heterodimers are cold-labile (compare SII with PI), although some insoluble E421K heterodimer remains after cold disassembly (PII). The efficiency of microtubule incorporation of TUBB2B-E421K-V5 αβ-heterodimers was 90 ± 17% relative to WT (mean ± SEM, n = 3, P > 0.05). PI, pellet following assembly; SII, soluble protein following cold-induced disassembly; PII, insoluble protein following cold-induced disassembly. Vertical lines denote the removal of irrelevant lanes. (D) Exogenously expressed TUBB2B-E421K-V5 (V5, red) co-localizes with α-tubulin (Dm1α, green), and has a filamentous appearance (high magnification, boxed regions), similar to TUBB2B-WT-V5, demonstrating efficient assembly with HeLa cell microtubules. (E) Quantitative western blot of total protein expression demonstrates lower amounts of mutant TUBB2B compared with WT. (F) Fluorescence analysis, after soluble protein extraction, demonstrates roughly equivalent efficiencies of incorporation between WT and mutant proteins, when adjusted for total protein expression in (E). Total TUBB2B-E421K-V5 protein expression is reduced by 43% compared with WT (WT = 1.0 ± 0.01, E421K = 0.57 ± 0.02, P < 0.0001; n = 3, n = one transfected culture), while the amount of incorporated TUBB2B-E421K-V5 protein is reduced by 25% (WT = 1.0 ± 0.05, E421K = 0.75 ± 0.05, P < 0.0005; n = 111 WT and 92 E421K, n = one cell). Scale bars: 10 µm (×63; left and middle panels), 2 µm (×100; high magnification, right panel).
Figure 8.
Figure 8.
The E421K substitution alters microtubule dynamics. (A) A representative carbendazim sensitivity assay. Diploid cells were serially diluted and plated on rich YPD media containing increasing concentrations of carbendazim, a microtubule destabilizing agent. The Tub2p haploinsufficient cells (TUB2+/−) were super-sensitive to carbendazim. In contrast, both heterozygous tub2-E410K and heterozygous tub2-E421K cells displayed increased resistance to carbendazim compared with WT cells. (B) Chart depicting a summary of more than three independent carbendazim assays with concentration ranging from 0 –21 μg/ml. Shaded boxes depict the degree of carbendazim resistance. (C) Life-time history plots of two representative individual microtubules from diploid WT (left), heterozygous tub2-E410K (center) or heterozygous tub2-E421K (right) cells in G1. (D) Parameters of dynamic instability determined for each strain. Notably, tub2-E421K microtubules show increased rates of polymerization, depolymerization, and reduced time spent in attenuation. Error given as standard deviation. Number of events is in parentheses. MT, microtubule. *P < 0.05, **P < 0.005 versus WT by unpaired Student's t-test.
Figure 9.
Figure 9.
E421K reduces the localization of kinesin Kip3p at microtubule plus-ends. (A) Representative Z-series maximum projections showing fluorescently labeled Kip3p (red) and α-tubulin (green) in live diploid WT, heterozygous tub2-E410K and heterozygous tub2-E421K yeast cells. Kip3p-3YFP forms bright foci at the plus-ends of most WT astral microtubules, but these bright foci are rarely found at the plus-ends of mutant astral microtubules (solid white arrowheads). Similar to microtubules in tub2-E410K cells, most astral microtubule plus-ends in tub2-E421K cells had a significant reduction in Kip3p-3YFP localization (open white arrowheads). Signal intensities were adjusted equally in both channels for all strains. (B) Quantification of Kip3p-3YFP levels at the plus-ends of microtubules in cells containing Tub2, tub2p-E410K and tub2p-E421K. Localization of Kip3p intensity was reduced by 58% in tub2-E421K cells and by 81% in tub2-E410K cells. 60–150 microtubules from three to four clones on two separate days each were imaged for each condition. n≥ 6 for all conditions. n represents the averaged values for each clone from 1 day. Error represented as SEM in graphs. P < 0.001 versus WT by unpaired Student's t-test.

References

    1. Little M., Seehaus T. Comparative analysis of tubulin sequences. Comp. Biochem. Physiol. B. 1988;90:655–670. - PubMed
    1. Luduena R.F. Are tubulin isotypes functionally significant. Mol. Biol. Cell. 1993;4:445–457. - PMC - PubMed
    1. Sullivan K.F., Cleveland D.W. Identification of conserved isotype-defining variable region sequences for four vertebrate beta tubulin polypeptide classes. PNAS. 1986;83:4327–4331. - PMC - PubMed
    1. Sullivan K.F., Havercroft J.C., Machlin P.S., Cleveland D.W. Sequence and expression of the chicken beta 5- and beta 4-tubulin genes define a pair of divergent beta-tubulins with complementary patterns of expression. Mol. Cell Biol. 1986;6:4409–4418. - PMC - PubMed
    1. Kaltschmidt B., Glatzer K.H., Michiels F., Leiss D., Renkawitz-Pohl R. During Drosophila spermatogenesis beta 1, beta 2 and beta 3 tubulin isotypes are cell-type specifically expressed but have the potential to coassemble into the axoneme of transgenic flies. Eur. J. Cell. Biol. 1991;54:110–120. - PubMed

Publication types

MeSH terms