Comparative Study
. 2013 Aug;70(2):454-65.
doi: 10.1002/mrm.24488. Epub 2012 Sep 21.

In vivo diffusion tensor MRI of the human heart: reproducibility of breath-hold and navigator-based approaches

Affiliations
Comparative Study

In vivo diffusion tensor MRI of the human heart: reproducibility of breath-hold and navigator-based approaches

Sonia Nielles-Vallespin et al. Magn Reson Med. 2013 Aug.

Erratum in

  • Magn Reson Med. 2014 Aug;72(2):599

Abstract

The aim of this study was to implement a quantitative in vivo cardiac diffusion tensor imaging (DTI) technique that was robust, reproducible, and feasible to perform in patients with cardiovascular disease. A stimulated-echo single-shot echo-planar imaging (EPI) sequence with zonal excitation and parallel imaging was implemented, together with a novel modification of the prospective navigator (NAV) technique combined with a biofeedback mechanism. Ten volunteers were scanned on two different days, each time with both multiple breath-hold (MBH) and NAV multislice protocols. Fractional anisotropy (FA), mean diffusivity (MD), and helix angle (HA) fiber maps were created. Comparison of initial and repeat scans showed good reproducibility for both MBH and NAV techniques for FA (P > 0.22), MD (P > 0.15), and HA (P > 0.28). Comparison of MBH and NAV FA (FAMBHday1 = 0.60 ± 0.04, FANAVday1 = 0.60 ± 0.03, P = 0.57) and MD (MDMBHday1 = 0.8 ± 0.2 × 10(-3) mm(2) /s, MDNAVday1 = 0.9 ± 0.2 × 10(-3) mm(2) /s, P = 0.07) values showed no significant differences, while HA values (HAMBHday1Endo = 22 ± 10°, HAMBHday1Mid-Endo = 20 ± 6°, HAMBHday1Mid-Epi = -1 ± 6°, HAMBHday1Epi = -17 ± 6°, HANAVday1Endo = 7 ± 7°, HANAVday1Mid-Endo = 13 ± 8°, HANAVday1Mid-Epi = -2 ± 7°, HANAVday1Epi = -14 ± 6°) were significantly different. The scan duration was 20% longer with the NAV approach. Currently, the MBH approach is the more robust in normal volunteers. While the NAV technique still requires resolution of some bulk motion sensitivity issues, these preliminary experiments show its potential for in vivo clinical cardiac diffusion tensor imaging and for delivering high-resolution in vivo 3D DTI tractography of the heart.

Keywords: cardiac diffusion tensor imaging; cardiac diffusion-weighted imaging; cardiovascular magnetic resonance imaging; prospective navigators.


Figures

FIG. 1
FIG. 1
ECG-gated diffusion-weighted STEAM sequence diagram with navigators. This sequence runs over two heartbeats and assumes that the heart is in the same position at both diffusion-encoding times (end systole) on consecutive cardiac cycles. To minimize the length of the single-shot EPI readout, parallel imaging with external reference lines and zonal excitation were implemented. The prospective navigators implemented were based on spin echoes with crossed 90°/180° slices and were applied before and after the STEAM module to guarantee that the first and second halves of the STEAM module were in the same breathing position. TD, delay time; TM, mixing or diffusion evolution time.
FIG. 2
FIG. 2
Example b0 and diffusion-encoded images for the MBH and NAV techniques (one average). This data demonstrates the typical image quality obtained throughout the study. The EPI images do not suffer from distortion artifacts due to the short EPI readout (16–20 readouts) achieved with parallel imaging and zonal excitation.
FIG. 3
FIG. 3
Example b0 images (eight averages) and derived FA, MD, and HA maps for MBH and NAV techniques at three contiguous slice locations in a normal volunteer, together with the segmentation scheme used to extract quantitative data from these maps. The MD and FA maps acquired with the MBH and NAV approaches are extremely similar and highly homogeneous. The transmural evolution in HA can be robustly seen in all slices with both techniques. [Color figure can be viewed in the online issue, which is available at wileyonlinelibrary.com.]
FIG. 4
FIG. 4
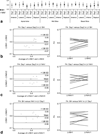
Fractional anisotropy (FA) in LV: Reproducibility and comparison of MBH versus NAV. a: Plot of the mean ± SD fractional anisot-ropy values for MBH and NAV, initial (day 1) and repeat (day 2) studies. b and c: Bland–Altman plots and line plots showing the interstudy reproducibility of the MBH (b) and NAV (c) methods. No statistically significant differences were found between initial and repeat studies. The mean fractional anisotropy value for the initial studies was 0.60 ± 0.04 for MBH and 0.60 ± 0.03 for NAV. d: Bland–Altman plot and line plot showing the MBH versus NAV method comparison. No statistically significant differences were seen between the MBH and NAV techniques.
FIG. 5
FIG. 5
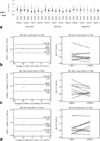
Mean diffusivity (MD) in LV: Reproducibility and comparison of MBH versus NAV. a: Plot of the mean ± SD MD values for MBH and NAV, initial (day 1) and repeat (day 2) studies. b and c: Bland–Alt-man plots and line plots showing the interstudy reproducibility of the MBH (b) and NAV (c) methods. No statistically significant differences were found between initial and repeat studies. The mean MD value for the initial studies was 0.8 ± 0.2 × 10⁻³ mm2/s for MBH and 0.9 ± 0.2 × 10⁻³ mm2/s for NAV. d: Bland–Altman plot and line plot showing the MBH versus NAV method comparison. No statistically significant differences were seen between the MBH and NAV techniques.
FIG. 6
FIG. 6
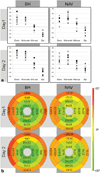
Helix angle (HA) in LV: Reproducibility and comparison of MBH versus NAV. a: Plot of the HA values for every volunteer and for MBH and NAV, initial (day 1) and repeat (day 2) studies. No statistically significant differences were found between the HA values in initial and repeat studies for either technique (MBH: P = 0.25, NAV: P = 0.28). b: Diagrams of the mean ± SD of the HA values over all volunteers. The diagrams depict the anterior, lateral, inferior, and septal regions further subdivided in the endocardial, midendocardial, midepicardial, and epicardial layers, as defined in the segmentation scheme in Figure 3. From this, it can be observed that the endocar-dial layer HA values are lower for NAV compared with MBH. [Color figure can be viewed in the online issue, which is available at wileyonlinelibrary.com.]
FIG. 7
FIG. 7
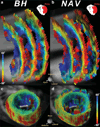
Three-dimensional visualization of tensor fields using superquadric glyphs (22) and 3D tractograms resulting from MBH and NAV acquisition techniques. a and b: Superquadric glyph fields within ROIs (red) located in the lateral wall of three contiguous short axis slices using MBH and NAV, respectively. The helical myofiber pattern is clearly depicted by the principal orientation of the superquadric glyphs. Variations in the glyph sizes and roundness (e.g., subendocar-dium) indicate that MBH and NAV are subject to different noise sensitivities. c and d: Overall perspective of 3D fiber tractograms using MBH and NAV, respectively. Both the MBH and NAV acquisitions depicted accurate transmural helical angles, which demonstrates the reproducibility of the NAV technique despite a relative higher noise level (as shown by the stretched fibers in the subepicardial layer).

References

    1. Streeter DD, Jr, Spotnitz HM, Patel DP, Ross J, Jr, Sonnenblick EH. Fiber orientation in the canine left ventricle during diastole and systole. Circ Res. 1969;24:339–347. - PubMed
    1. Streeter DD, Jr, Hanna WT. Engineering mechanics for successive states in canine left ventricular myocardium. II. Fiber angle and sarcomere length. Circ Res. 1973;33:656–664. - PubMed
    1. Edelman RR, Gaa J, Wedeen VJ, Loh E, Hare JM, Prasad P, Li W. In vivo measurement of water diffusion in the human heart. Magn Reson Med. 1994;32:423–428. - PubMed
    1. Reese TG, Weisskoff RM, Smith RN, Rosen BR, Dinsmore RE, Wedeen VJ. Imaging myocardial fiber architecture in vivo with magnetic resonance. Magn Reson Med. 1995;34:786–791. - PubMed
    1. Tseng WY, Reese TG, Weisskoff RM, Brady TJ, Wedeen VJ. Myocardial fiber shortening in humans: initial results of MR imaging. Radiology. 2000;216:128–139. - PubMed

Publication types

MeSH terms