. 2012 Dec;31(12):2877-87.
doi: 10.1002/etc.2018. Epub 2012 Nov 7.

Bridging environmental mixtures and toxic effects

Affiliations

Bridging environmental mixtures and toxic effects

Sarah E Allan et al. Environ Toxicol Chem. 2012 Dec.

Abstract

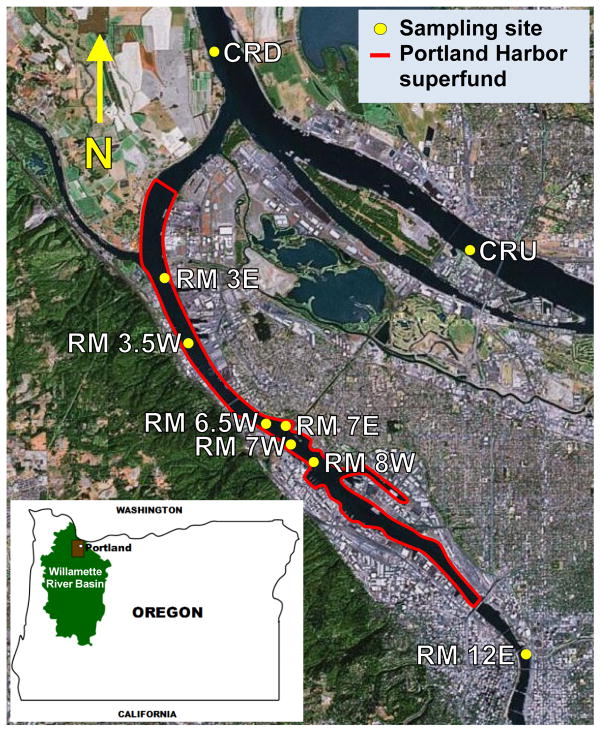
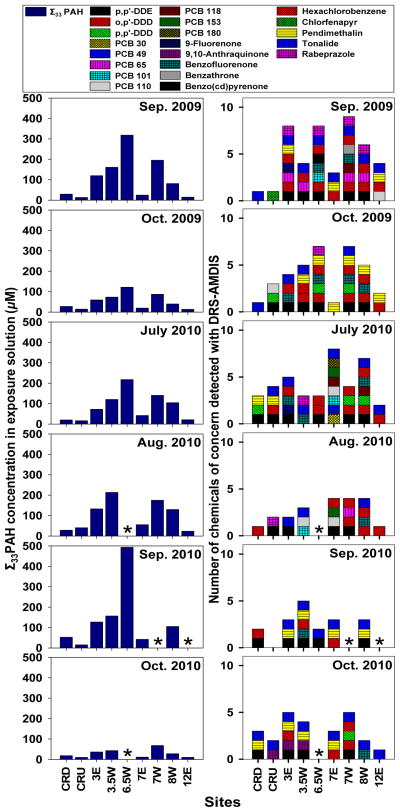
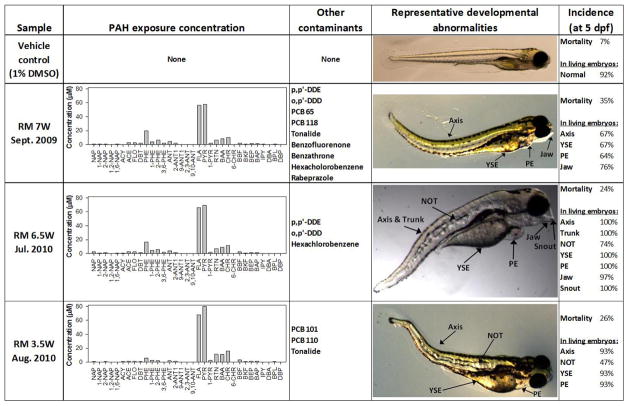
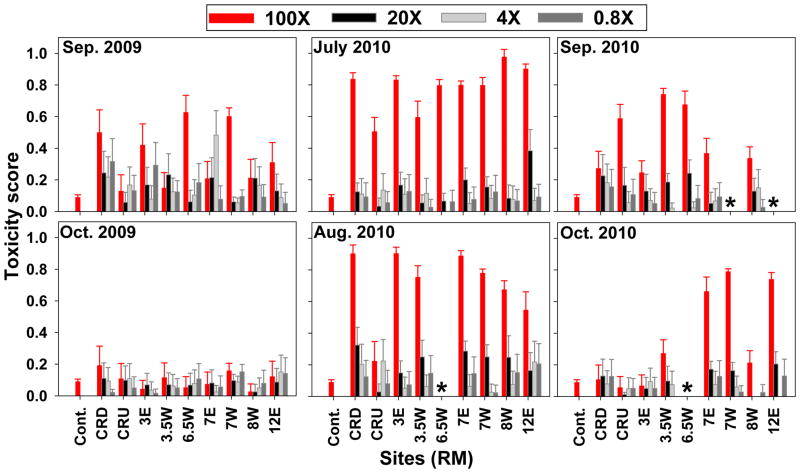
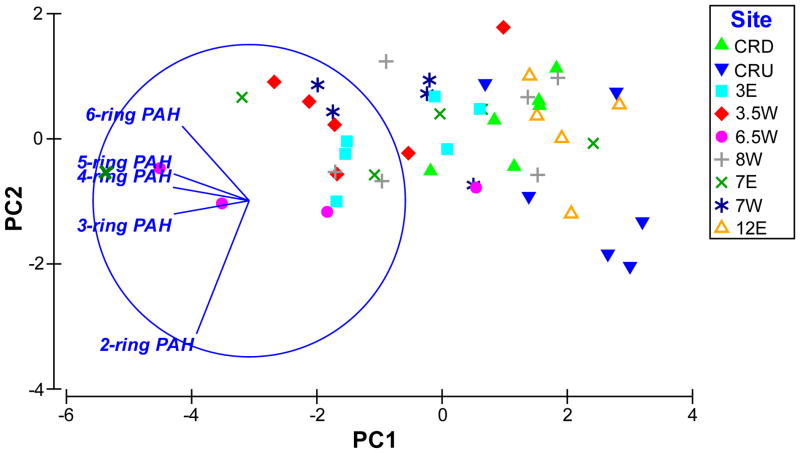
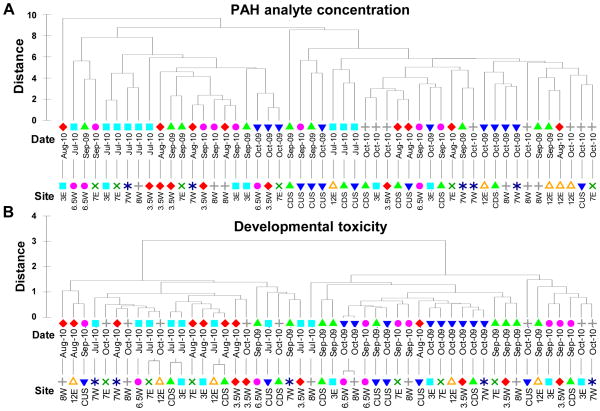
Biological Response Indicator Devices Gauging Environmental Stressors (BRIDGES) is a bioanalytical tool that combines passive sampling with the embryonic zebrafish developmental toxicity bioassay to provide a quantitative measure of the toxicity of bioavailable complex mixtures. Passive sampling devices (PSDs), which sequester and concentrate bioavailable organic contaminants from the environment, were deployed in the Willamette and Columbia Rivers within and outside of the Portland Harbor Superfund site in Portland, OR, USA. Six sampling events were conducted in the summer and fall of 2009 and 2010. Passive sampling device extracts were analyzed for polycyclic aromatic hydrocarbon (PAH) compounds and screened for 1,201 chemicals of concern using deconvolution-reporting software. The developmental toxicity of the extracts was analyzed using the embryonic zebrafish bioassay. The BRIDGES tool provided site-specific, temporally resolved information about environmental contaminant mixtures and their toxicity. Multivariate modeling approaches were applied to paired chemical and toxic effects data sets to help unravel chemistry-toxicity associations. Modeling elucidated spatial and temporal trends in PAH concentrations and the toxicity of the samples and identified a subset of PAH analytes that were the most highly correlated with observed toxicity. Although the present study highlights the complexity of discerning specific bioactive compounds in complex mixtures, it demonstrates methods for associating toxic effects with chemical characteristics of environmental samples.


Figures

Figure 1
Figure 1. Study area and sampling sites
The Willamette River flows north, through metropolitan Portland, Oregon to its confluence with the Columbia River, which flows west along the border between Oregon and Washington State. The Portland Harbor Superfund area, on the Willamette River, is outlined in red. The sites where PSDs were deployed in 2009–2010 are indicated by yellow circles. Seven sites along the Willamette River are labeled with the river mile (RM) and the east (E) or west (W) bank that they are located near. Two sites on the Columbia River are located upstream (CRU) and downstream (CRD) of the Willamette River confluence.
Figure 2
Figure 2. Chemical characterization of PSD extracts from Portland Harbor
The concentrations of the sum of 33 PAH analytes in the highest dose (100X) exposure solutions used in the zebrafish bioassay is shown on the left. The number of chemicals of concern that were identified in samples from each site and sampling event are shown on the right. The colors/patterns of the blocks indicate which chemicals were identified in the samples. Asteriscs indicate when samples were not obtained.
Figure 3
Figure 3. Morphological malformations observed in embryos exposed to chemical mixtures in PSD extracts at 5 dpf
The concentrations of PAH analytes and presence of other chemicals of concern in exposure solutions composed of 1% PSD extract obtained from sites within the Portland Harbor Superfund are shown. Examples of developmental abnormalities in 5 day post fertilization (dpf) embryos exposed to PSD extract solutions include mortality, yolk sac edema (YSE), pericardial edema (PE) and malformations of the body axis, trunk, notochord (NOT), jaw and snout. Normal development in an embryo exposed to the vehicle control is also pictured. Not all deformities pictured are labeled.
Figure 4
Figure 4. Developmental toxicity of PSD extracts
The developmental toxicity of each sample was scored based on the presence or absence of 21 toxic outcomes. Bars represent the average score of all embryos exposed to the sample (n=40 per treatment) and lines represent the standard deviation. Scores range from 0–1 where 0 is indicative of normal development and 1 represents mortality at the earliest time point. The highest concentration (100X; red bars) was 1% PSD extract and the other exposure concentrations are successive five-fold dilutions of the extract (20X, 4X and 0.8X). The average outcome of the 1% DMSO control (Cont.) is shown on each graph for comparison. Asterisks indicate that samples were not obtained from the field. See Figure 2.1 for the location of the sampling sites.
Figure 5
Figure 5. PCA of PAH data
A plot of PC1 and PC2 for PAH concentrations by ring size visually demonstrates variability in the chemical characteristics of PSD samples from different sites and sampling events along the lower Willamette River. See Figure 1 for the location of the sampling sites. PC1 and PC2 represent 80.1% and 14.3% of the variability in the data set, respectively. Data was normalized to achieve a common scale and forth root transformed to reduce data clustering and facilitate visualization. The vectors point in the direction of increasing variable values in terms of PC1 and PC2 and their length represents relative contribution of the variable to the plotted axis where the circle indicates maximum contribution.
Figure 6
Figure 6. Dendograms of MDS results for chemical and toxicity characteristics of environmental samples
Dendograms show the similarity of samples to one another in terms of PAH analyte concentrations (A) and developmental toxicity (B). Distance is a high-dimensional measure of similarity between samples with multiple variable measurements. PAH similarity matrices were constructed using the concentrations of all quantified analytes at the highest exposure concentration and data were normalized prior to analysis. The developmental toxicity similarity matrices were constructed from the percent incidence of each observed developmental endpoint in embryos exposed to the highest concentration PSD extract solution. The sampling date and site labels for each sample are shown; symbols are a visualization guide only and repetition of symbols between date and site labels does not indicate an association.

References

    1. Huckins JN, Tubergen M, Manuweera G. Semipermeable membrane devices containing model lipid: a new approach to monitoring the bioavailability of lipophilic contaminants and estimating their bioconcentration potential. Chemosphere. 1990;20:533–552.
    1. Vijver MG, Peijnenburg WJGM, De Snoo GR. Toxicological Mixture Models are Based on Inadequate Assumptions. Environ Sci Technol. 2010;44:4841–4842. - PubMed
    1. Eggen RIL, Behra R, Burkhardt-Holm P, Escher BI, Schweigert N. Challenges in Ecotoxicology. Environ Sci Technol. 2004;38:58A–64A. - PubMed
    1. Hillwalker WE, Allan SE, Tanguay RL, Anderson KA. Exploiting lipid-free tubing passive samplers and embryonic zebrafish to link site specific contaminant mixtures to biological responses. Chemosphere. 2010;79:1–7. - PMC - PubMed
    1. Legler J, van Velzen M, Cenijn PH, Houtman CJ, Lamoree MH, Wegener JW. Effect-Directed Analysis of Municipal Landfill Soil Reveals Novel Developmental Toxicants in the Zebrafish Danio rerio. Environ Sci Technol. 2011:null–null. - PubMed

Publication types

MeSH terms

Substances