. 2012 Dec;60(12):2050-64.
doi: 10.1002/glia.22419. Epub 2012 Sep 21.

Activation of KCNN3/SK3/K(Ca)2.3 channels attenuates enhanced calcium influx and inflammatory cytokine production in activated microglia

Affiliations

Activation of KCNN3/SK3/K(Ca)2.3 channels attenuates enhanced calcium influx and inflammatory cytokine production in activated microglia

Amalia M Dolga et al. Glia. 2012 Dec.

Abstract

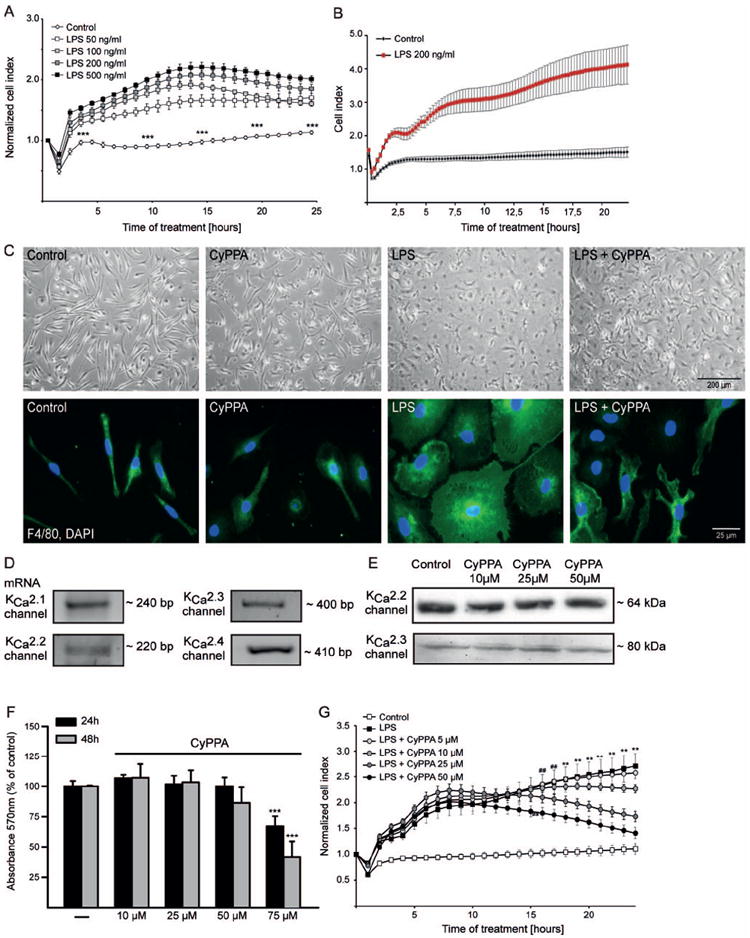
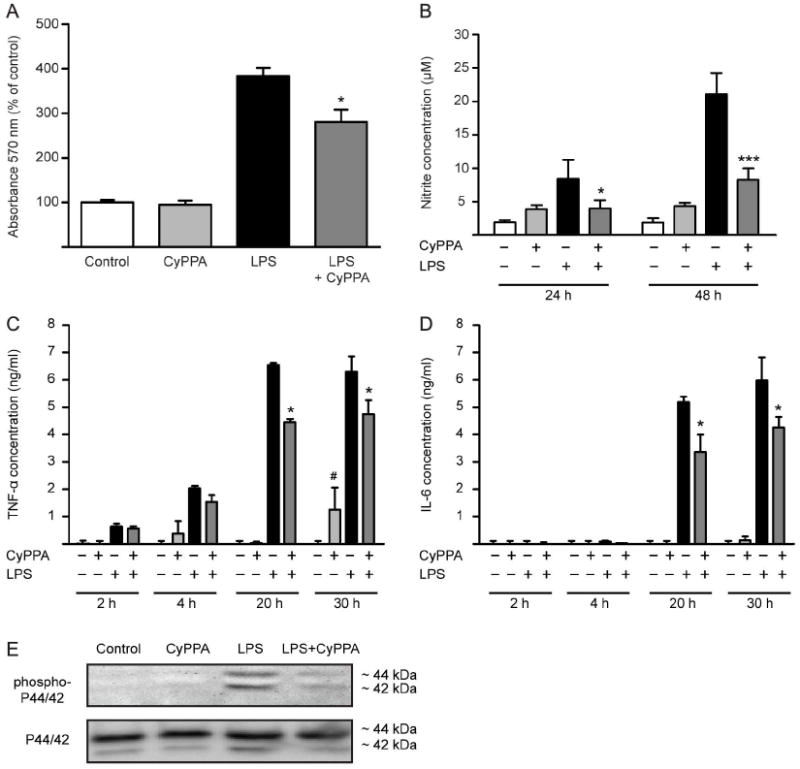
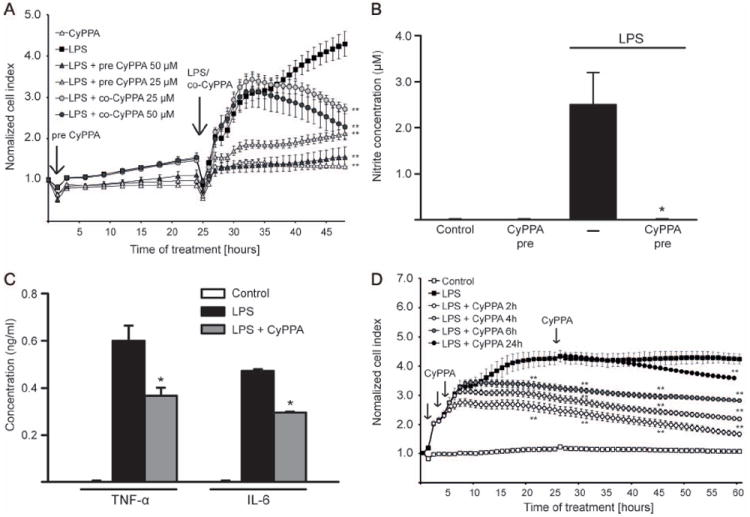
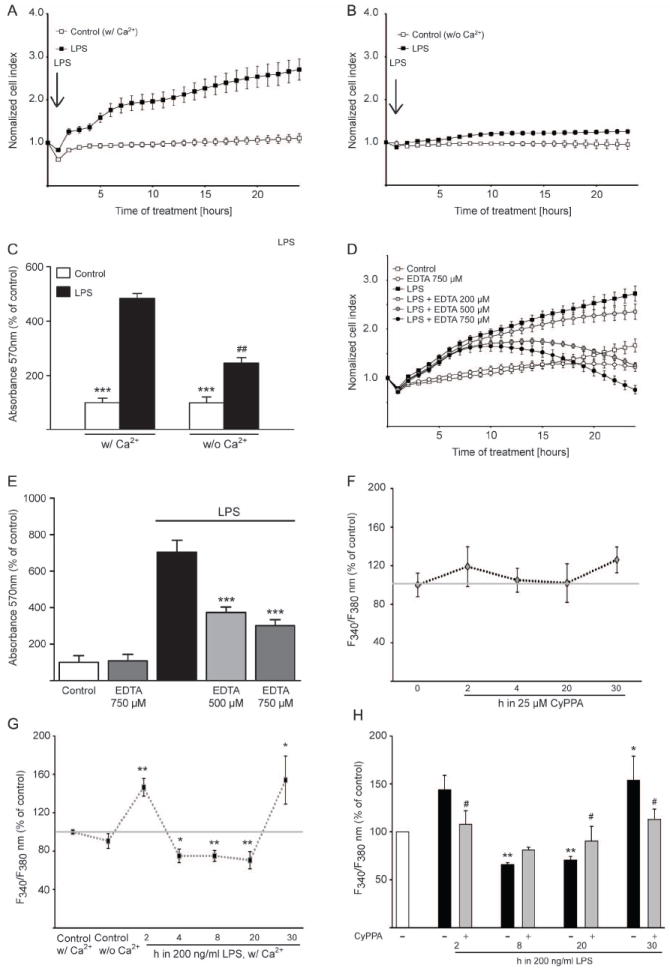
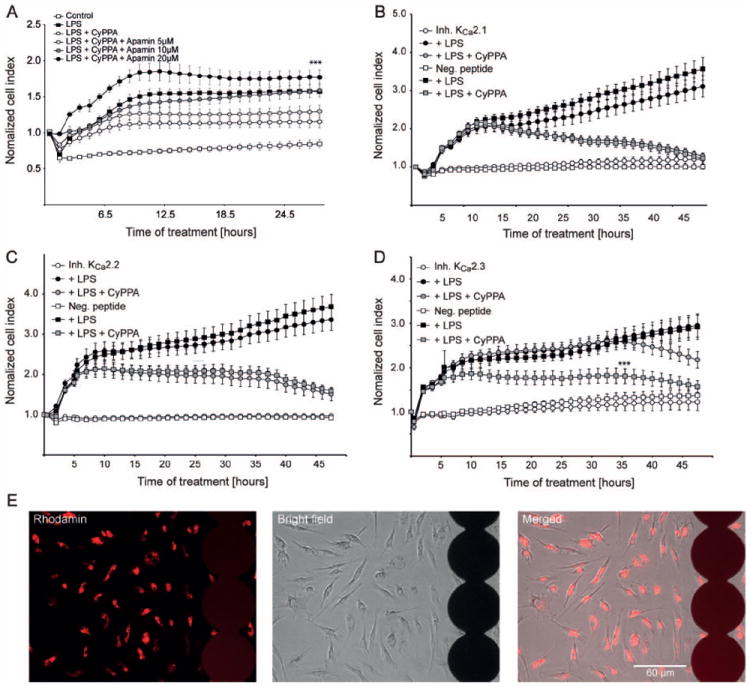
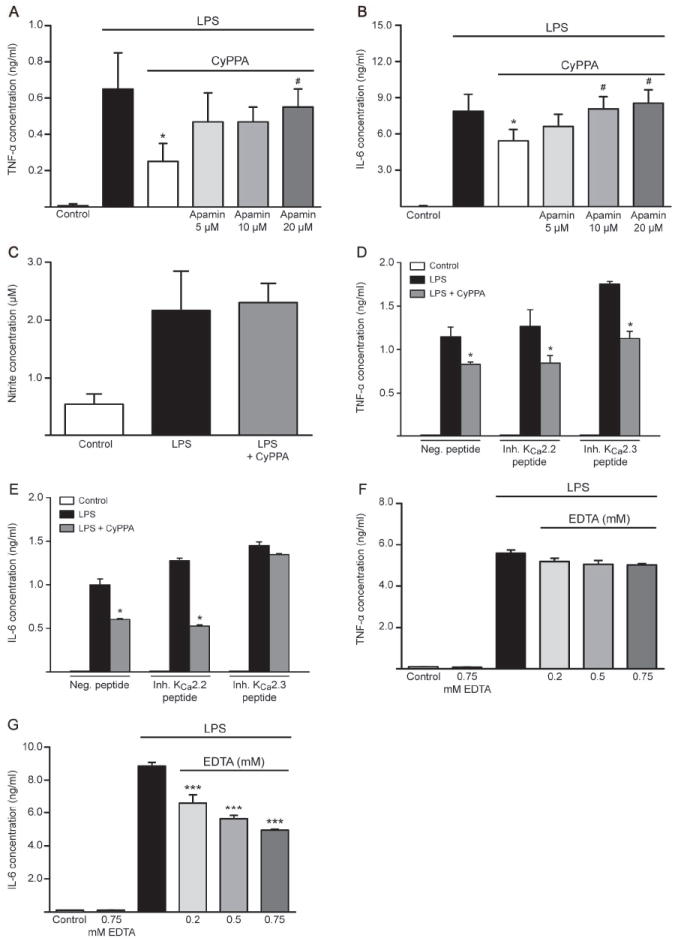
In neurons, small-conductance calcium-activated potassium (KCNN/SK/K(Ca)2) channels maintain calcium homeostasis after N-methyl-D-aspartate (NMDA) receptor activation, thereby preventing excitotoxic neuronal death. So far, little is known about the function of KCNN/SK/K(Ca)2 channels in non-neuronal cells, such as microglial cells. In this study, we addressed the question whether KCNN/SK/K(Ca)2 channels activation affected inflammatory responses of primary mouse microglial cells upon lipopolysaccharide (LPS) stimulation. We found that N-cyclohexyl-N-[2-(3,5-dimethyl-pyrazol-1-yl)-6-methyl-4-pyrimidinamine (CyPPA), a positive pharmacological activator of KCNN/SK/K(Ca)2 channels, significantly reduced LPS-stimulated activation of microglia in a concentration-dependent manner. The general KCNN/SK/K(Ca)2 channel blocker apamin reverted these effects of CyPPA on microglial proliferation. Since calcium plays a central role in microglial activation, we further addressed whether KCNN/SK/K(Ca)2 channel activation affected the changes of intracellular calcium levels, [Ca(2+)](i), in microglial cells. Our data show that LPS-induced elevation of [Ca(2+)](i) was attenuated following activation of KCNN2/3/K(Ca)2.2/K(Ca)2.3 channels by CyPPA. Furthermore, CyPPA reduced downstream events including tumor necrosis factor alpha and interleukin 6 cytokine production and nitric oxide release in activated microglia. Further, we applied specific peptide inhibitors of the KCNN/SK/K(Ca)2 channel subtypes to identify which particular channel subtype mediated the observed anti-inflammatory effects. Only inhibitory peptides targeting KCNN3/SK3/K(Ca)2.3 channels, but not KCNN2/SK2/K(Ca)2.2 channel inhibition, reversed the CyPPA-effects on LPS-induced microglial proliferation. These findings revealed that KCNN3/SK3/K(Ca)2.3 channels can modulate the LPS-induced inflammatory responses in microglial cells. Thus, KCNN3/SK3/K(Ca)2.3 channels may serve as a therapeutic target for reducing microglial activity and related inflammatory responses in the central nervous system.


Conflict of interest statement

Competing financial interests

The authors declare no competing financial interests.

Figures

Figure 1
Figure 1. LPS induces primary microglial activation
A. Microglial cells were seeded in 96 well E-plates at a density of 15000 cells/well and monitored with a real-time impedance-based xCELLigence system. After 24 h, cells were challenged with different concentrations of LPS, ranging from 50 to 500 ng/ml, as indicated. The time point of LPS treatment or media change is marked as “0 h” in the graph. B. Representative LPS kinetic curve using xCELLigence system (n=6 wells). The time point of LPS treatment or media change is marked as “0 h” in the graph. C. Morphometric alterations of activated microglia were visualized by bright-field microscope and by immunostaining with F4/80 antibody. D. mRNA analysis of KCNN/SK/KCa2 channel subtypes. E. Western blot analysis of KCNN2/SK2/KCa2.2 and KCNN3/SK3/KCa2.3 channels in microglial cells treated in the presence or absence of different concentrations of CyPPA, ranging from 10 to 50μM. F. MTT analysis of microglial cells treated with different concentrations of CyPPA for 24 and 48 h. Results are given as mean values ± S.D. (***p<0.001 versus non-treated microglia, ANOVA, Scheffé’s test, n=18 wells, repeated 3 times with independent primary microglia preparations). G. xCELLigence analysis of microglial cells treated with 200 ng/ml LPS, in the presence or absence of different concentrations of CyPPA (5–50 μM), as indicated. The time point of treatment is marked as “0 h” in the graph (**p<0.01 versus CyPPA-treated microglia (25μM), ##p<0.01 versus CyPPA-treated (50μM) microglia, ANOVA, Scheffé’s test, n=6 wells, experiment repeated at least 3 times with independent primary microglia preparations).
Figure 2
Figure 2. CyPPA prevents cytokine release
A. MTT analysis of microglial cells treated with CyPPA (25 μM) for 24 in the presence of LPS (200 ng/ml). Results shown represent mean ± S.D. (*p<0.05 versus LPS-treated microglia, ANOVA, Scheffé’s test, n=6 wells, experiment repeated at least 3 times with independent primary microglia preparations). B. NO production of microglial cells treated with 200 ng/ml LPS in the presence and absence of CyPPA (25 μM). The effects of CyPPA (25 μM) on cytokine production, TNF-α (C) and IL-6 (D) in LPS (200 ng/ml)-activated microglia for 2-30 h. Results represent mean S.D. (*p <0.05; ***p<0.001 versus LPS-treated microglia; #p<0.05 versus non-treated cells, U-test Mann-Whitney, n=3). E. Western blot analysis of phosphorylated and non-phosphorylated p44/p42 MAPK in microglial cells treated in the presence or absence of CyPPA (25 μM) and LPS (200 ng/ml).
Figure 3
Figure 3. Activation of KCNN2/3/KCa2.2/KCa2.3 channels prevents microglial activation
A. Microglial cells were seeded in 96 well E-plates with a density of 15000 cells/well and monitored with a real-time xCELLigence impedance-based system. Some microglial culture were pre-treated with CyPPA (25 and 50 μM) for 24 h (indicated as “LPS+pre CyPPA”). Afterwards, cells with or without CyPPA pre-incubation were challenged with LPS (200 ng/ml), as indicated by an arrow on the kinetic curve. To demonstrate that CyPPA is able to reduce LPS-induced cell index increase, some microglia were co-treated with LPS and CyPPA (indicated as “LPS+co-CyPPA”). The time point of CyPPA treatment initiation or media change is marked as “0 h” and of LPS challenge as “24 h” (n=6 wells, experiment repeated at least 3 times with independent primary microglia cultures, **p<0.01 versus LPS-treated microglia, ANOVA, Scheffé’s test). B. NO production of microglial cells pre-treated with CyPPA (25μM) in the presence and absence of LPS (200 ng/ml) (*p <0.05 versus LPS-treated microglia, U-test Mann-Whitney, n=3, experiment repeated 3 times with independent primary microglia cultures). C. Cytokine production in microglial cells pre-treated with CyPPA (25μM, 24 h) and followed by LPS challenge (200 ng/ml, 8 h). (*p <0.05 versus LPS-treated microglia, U-test Mann-Whitney, n=3, experiment repeated at least 3 times with independent primary microglia cultures). D. Microglial cells were challenged with LPS (200 ng/ml) followed by CyPPA treatment 2, 4, 6 and 24 h post LPS application (as indicated by black arrows on the graph). Microglial cells were monitored with a real-time xCELLigence impedance-based system for 60 h. The time point of LPS treatment initiation or media change is marked as “0 h” in the graph (n=4-6 different wells, experiment repeated at least 3 times with independent primary microglia cultures,**p<0.01 versus LPS-treated microglia, ANOVA, Scheffé’s test).
Figure 4
Figure 4. Extracellular calcium is a prerequisite for microglial activation
Morphological alterations of microglial cells were detected by real-time impedance-based system. A. Microglia was challenged with 200 ng/ml LPS in the presence of extracellular calcium or (B) in calcium-free medium. The time point of treatment is marked as “0 h” in the graph (n=6 different wells, experiment repeated 3 times with independent primary microglia cultures). C. MTT analysis of microglial cells challenged with LPS (200ng/ml) in calcium-containing medium as well as in calcium-free medium (***p<0.001 versus LPS-treated microglia, ##p<0.01 versus LPS-treated cells in calcium-containing medium, ANOVA, Scheffé’s test, n=6 different wells, experiment repeated 3 times with independent primary microglia cultures). D. xCELLigence measurements of LPS-activated cells co-treated with different concentrations of EDTA, ranging from 200 to 750 μM, as indicated. E. MTT analysis of microglia activated by 200 ng/ml LPS in the presence of the extracellular calcium chelator, EDTA (500 and 750 μM). Results represent mean ± S.D. (***p<0.001 versus LPS-treated microglia, ANOVA, Scheffé’s test, n=6, experiment repeated 3 times with independent primary microglia cultures). F-H. Calcium measurements were performed with Fura-2AM calcium sensor. Basic intracellular Ca2+ changes (F340/F380) during the first 30 h (F,n = 3 independent experiments from different primary microglial preparations, with 30-40 cells measured per condition) after incubation with 25μM CyPPA (F) or 200 ng ml−1 LPS (G). (n = 30-40 cells, **p<0.01 versus untreated microglia, #p<0,05 versus LPS-treated microglia, ANOVA, Scheffé’s test, n=3 independent experiments). H. Microglia cells were challenged with 200 ng/ml LPS for 2-30 h. Some cells were treated with CyPPA (25μM) and the intracellular calcium was measured with Fura-2AM calcium sensor. Results represent mean ± S.D. (***p<0.001 versus LPS-treated microglia, ANOVA, Scheffé’s test, n=3).
Figure 5
Figure 5. Prevention of microglial activation is dependent on KCNN3/SK3/KCa2.3 channels
A. Microglial cells were seeded in 96 well E-plates with a density of 15000 cells/well and monitored with a real-time xCELLigence impedance-based system. Microglial cells were challenged with LPS (200 ng/ml) and co-treated with CyPPA (25 μM) in the presence and absence of different concentrations of apamin. The time point of pre-treatment is marked as “0 h” in the graph (n=6 wells, experiment repeated 3 times with independent primary microglia cultures, ***p <0.001 versus CyPPA-treated microglia, ANOVA, Scheffé’s test). B. xCELLigence measurements of microglial cells transfected with inhibitory peptides specific for (B) KCNN1/SK1/KCa2.1, (C) KCNN2/SK2/KCa2.2 or (D) KCNN3/SK3/KCa2.3 channels. Cells were treated with 200 ng/ml LPS in the presence or absence of 25 μM CyPPA. The time point of pre-treatment is marked as “0 h” in the graph (n=6, ***p <0.001 versus LPS+CyPPA-treated microglia transfected with KCa2.3 inhibitory peptides, ANOVA, Scheffé’s test). E. The transfection efficacy of the ProJect™ transfection kit was assessed with rhodamine-labeled peptides (red fluorescence) using. The photomicrographs show the transfected cells growing on the electrode layer (black circles) of E-plates that enable cellular impedance measurements.
Figure 6
Figure 6. KCa2.3 regulates microglial activation pathways
Cytokine production, TNF-α (A) and IL-6 (B) in microglial cells co-treated with LPS (200 ng/ml) and CyPPA (25 μM) in the presence and absence of different concentrations of apamin. Results represent mean ± S.D. (*p <0.05 versus LPS-treated microglia, #p<0.05 versus CyPPA-treated microglia, U-test Mann-Whitney, n=3, experiment repeated 3 times with independent primary microglia cultures). C. NO release in microglial cells transfected with inhibitory peptides for KCNN3/SK3/KCa2.3 channels. Results shown represent mean ± S.D. (n=3, experiment repeated 3 times with independent primary microglia cultures). D. TNF-α and E. IL-6 production in microglial cells transfected with inhibitory peptides for KCNN2/SK2/KCa2.2 and KCNN3/SK3/KCa2.3 channels and challenged with LPS (200 ng/ml) in the presence of CyPPA (25 μM). Results are presented as mean values ± S.D. (*p <0.05 versus LPS-treated microglia, U-test Mann-Whitney, n=3, experiment repeated 3 times with independent primary microglia cultures). F. TNF-α and G. IL-6 production in microglial cells and co-treated with different concentrations of EDTA, as indicated. Results are shown as mean values ± S.D. (***p <0.001 versus LPS-treated microglia, U-test Mann-Whitney, n=6, experiment repeated 3 times with independent primary microglia cultures).

References

    1. Allen D, Nakayama S, Kuroiwa M, Nakano T, Palmateer J, Kosaka Y, Ballesteros C, Watanabe M, Bond CT, Luján R, Maylie J, Adelman JP, Herson PS. SK2 channels are neuroprotective for ischemia-induced neuronal cell death. J Cereb Blood Flow Metab. 2011;31:2302–2312. - PMC - PubMed
    1. Beck A, Penner R, Fleig A. Lipopolysaccharide-induced down-regulation of Ca2+ release-activated Ca2+ currents (I CRAC) but not Ca2+-activated TRPM4-like currents (I CAN) in cultured mouse microglial cells. J Physiol. 2008;586:427–439. - PMC - PubMed
    1. Bordey A, Spencer DD. Chemokine modulation of high-conductance Ca2+-sensitive K+ currents in microglia from human hippocampi. Eur J Neurosci. 2003;18:2893–2898. - PubMed
    1. Boucsein C, Kettenmann H, Nolte C. Electrophysiological properties of microglial cells in normal and pathologic rat brain slices. Eur J Neurosci. 2000;12:2049–2058. - PubMed
    1. Chan WY, Kohsaka S, Rezaie P. The origin and cell lineage of microglia—New concepts. Brain Res Rev. 2007;53:344–354. - PubMed

Publication types

MeSH terms