

Initial testing (stage 1) of the phosphatidylinositol 3' kinase inhibitor, SAR245408 (XL147) by the pediatric preclinical testing program
- PMID: 23002019
- PMCID: PMC4684943
- DOI: 10.1002/pbc.24301
Initial testing (stage 1) of the phosphatidylinositol 3' kinase inhibitor, SAR245408 (XL147) by the pediatric preclinical testing program
Abstract
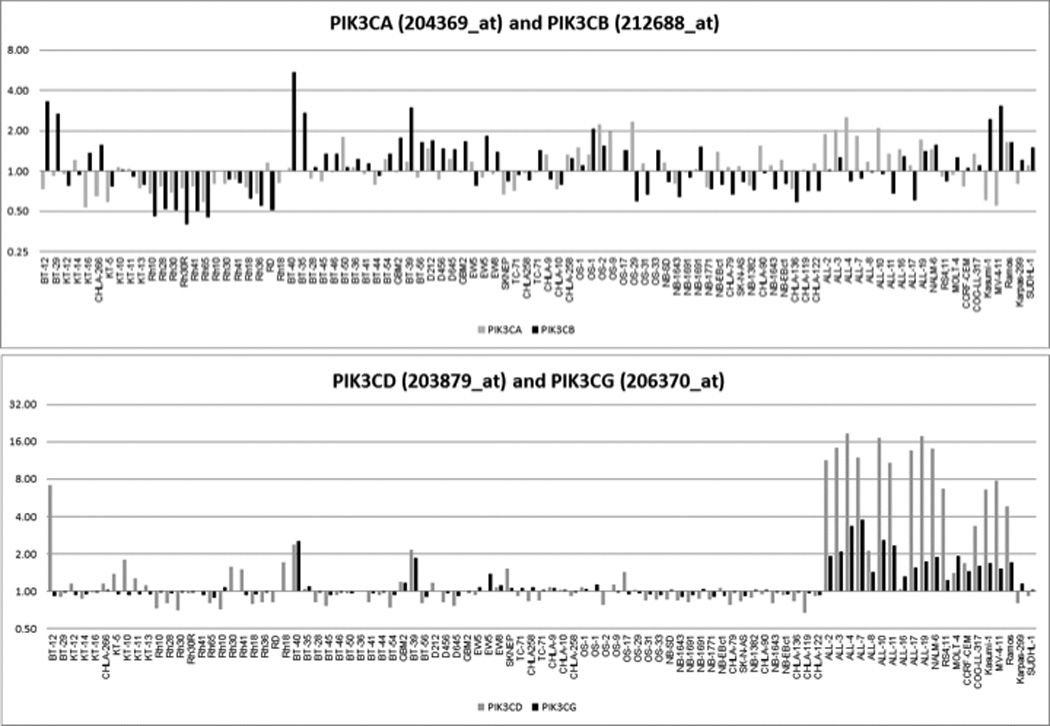
Background: Activation of the PI3 kinase pathway occurs frequently in many adult cancers and is implicated in tumor cell proliferation, survival, and resistance to chemotherapy and radiotherapy. However, less is known regarding the relevance of this pathway in pediatric cancers. Here we have evaluated SAR245408, a novel small molecule PI3K inhibitor, against childhood cancer cell lines and xenografts.
Procedures: SAR245408 was tested against the PPTP in vitro cell line panel at concentrations from 10 to 100 µM and against the PPTP in vivo xenograft panels at a dose of 100 mg/kg administered orally daily × 14.
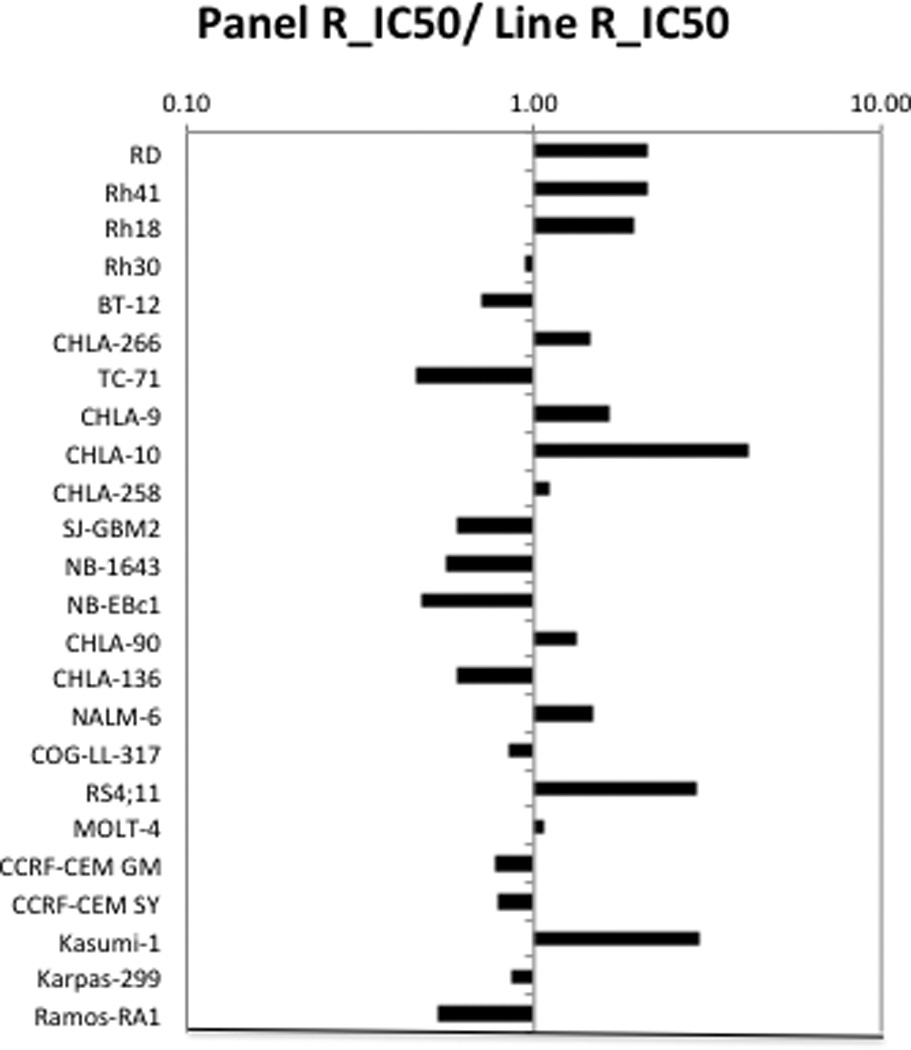
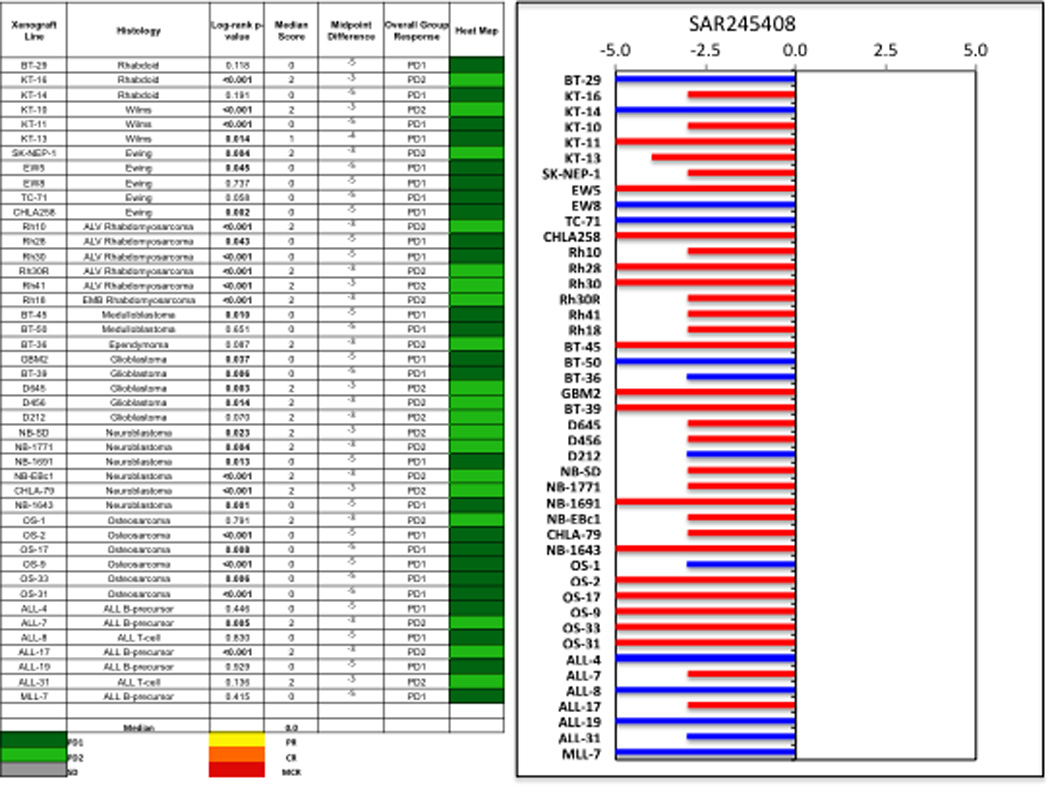
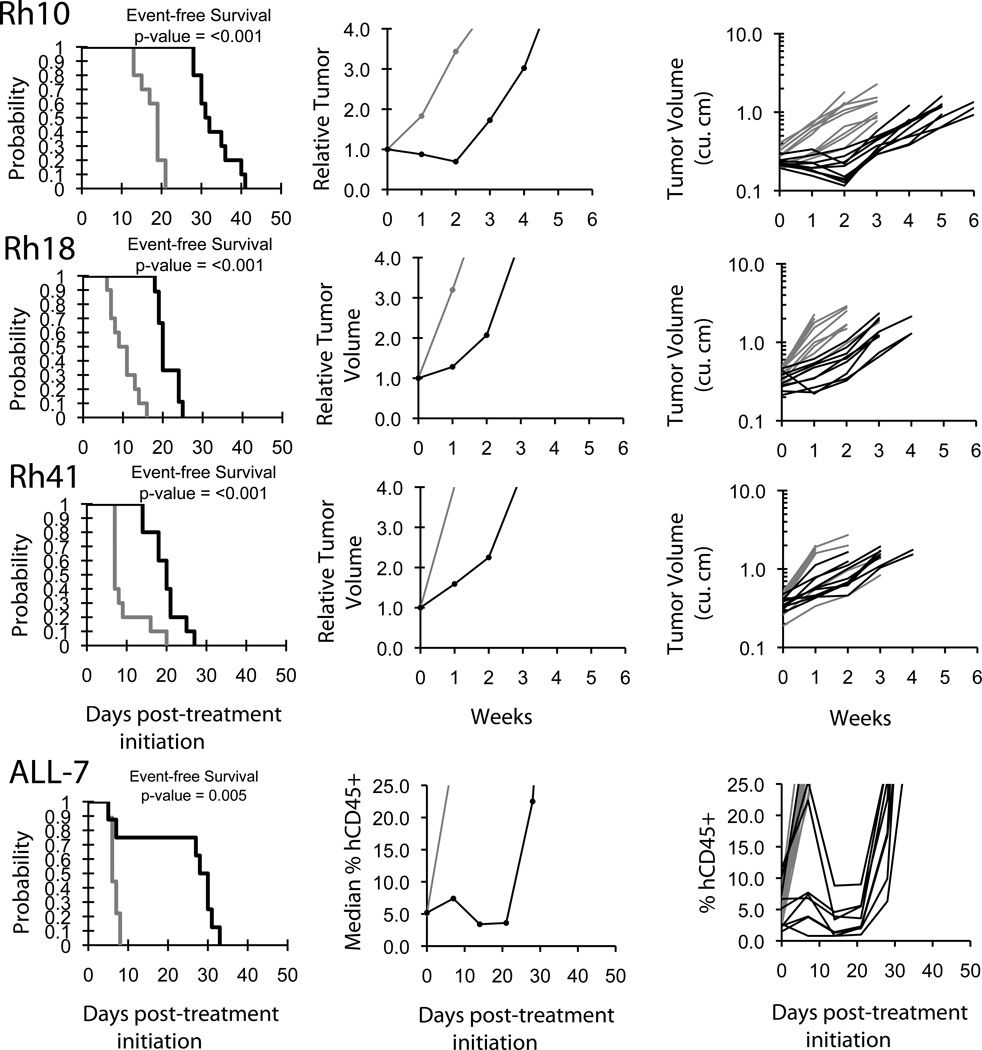
Results: In vitro SAR245408 demonstrated cytotoxic activity, with a median relative IC50 value of 10.9 µM (range 2.7-24.5 µM). SAR245408 was well tolerated in vivo, and all 44 tested xenograft models were evaluable for efficacy. SAR245408 induced significant differences in EFS distribution compared to control in 29 of 37 (79%) of solid tumor xenografts and in two of seven (29%) ALL xenografts. SAR245408 induced tumor growth inhibition meeting criteria for intermediate EFS T/C activity (EFS T/C > 2) in 4 of 37 (11%) solid tumor xenografts. Intermediate EFS T/C activity was also observed for two of seven (29%) evaluable ALL xenografts. Objective responses were not observed for solid tumor or for ALL xenografts.
Conclusions: Under the conditions evaluated in this study, SAR245408 achieved modest single-agent activity against most PPTP preclinical models. Further exploration of SAR245408 in combination with standard agents or with other signaling inhibitors could be considered.
Copyright © 2012 Wiley Periodicals, Inc.
Conflict of interest statement
Figures
Similar articles
-
The Selective PI3K Inhibitor XL147 (SAR245408) Inhibits Tumor Growth and Survival and Potentiates the Activity of Chemotherapeutic Agents in Preclinical Tumor Models.Mol Cancer Ther. 2015 Apr;14(4):931-40. doi: 10.1158/1535-7163.MCT-14-0833. Epub 2015 Jan 30. Mol Cancer Ther. 2015. PMID: 25637314
-
Initial testing of the aurora kinase A inhibitor MLN8237 by the Pediatric Preclinical Testing Program (PPTP).Pediatr Blood Cancer. 2010 Jul 15;55(1):26-34. doi: 10.1002/pbc.22430. Pediatr Blood Cancer. 2010. PMID: 20108338 Free PMC article.
-
Initial testing (stage 1) of the multi-targeted kinase inhibitor sorafenib by the pediatric preclinical testing program.Pediatr Blood Cancer. 2010 Dec 1;55(6):1126-33. doi: 10.1002/pbc.22712. Pediatr Blood Cancer. 2010. PMID: 20672370 Free PMC article.
-
Initial testing (stage 1) of the Polo-like kinase inhibitor volasertib (BI 6727), by the Pediatric Preclinical Testing Program.Pediatr Blood Cancer. 2014 Jan;61(1):158-64. doi: 10.1002/pbc.24616. Epub 2013 Aug 19. Pediatr Blood Cancer. 2014. PMID: 23956067 Free PMC article.
-
Initial testing (stage 1) of the Akt inhibitor GSK690693 by the pediatric preclinical testing program.Pediatr Blood Cancer. 2010 Dec 15;55(7):1329-37. doi: 10.1002/pbc.22710. Epub 2010 Aug 25. Pediatr Blood Cancer. 2010. PMID: 20740623 Free PMC article.
Cited by
-
Initial testing (stage 1) of the investigational mTOR kinase inhibitor MLN0128 by the pediatric preclinical testing program.Pediatr Blood Cancer. 2014 Aug;61(8):1486-9. doi: 10.1002/pbc.24989. Epub 2014 Feb 20. Pediatr Blood Cancer. 2014. PMID: 24623675 Free PMC article.
-
Pilaralisib inhibits the replication of enteroviruses by targeting the PI3K/AKT signaling pathway.Virol J. 2025 Jul 28;22(1):257. doi: 10.1186/s12985-025-02881-w. Virol J. 2025. PMID: 40717083 Free PMC article.
-
Molecular profiling of childhood cancer: Biomarkers and novel therapies.BBA Clin. 2014 Jun 28;1:59-77. doi: 10.1016/j.bbacli.2014.06.003. eCollection 2014 Jun. BBA Clin. 2014. PMID: 26675306 Free PMC article. Review.
-
Evaluation of In Vitro Activity of the Class I PI3K Inhibitor Buparlisib (BKM120) in Pediatric Bone and Soft Tissue Sarcomas.PLoS One. 2015 Sep 24;10(9):e0133610. doi: 10.1371/journal.pone.0133610. eCollection 2015. PLoS One. 2015. PMID: 26402468 Free PMC article.
-
Aurora B kinase is a potent and selective target in MYCN-driven neuroblastoma.Oncotarget. 2015 Nov 3;6(34):35247-62. doi: 10.18632/oncotarget.6208. Oncotarget. 2015. PMID: 26497213 Free PMC article.
References
-
- Hennessy BT, Smith DL, Ram PT, et al. Exploiting the PI3K/AKT pathway for cancer drug discovery. Nature reviews Drug discovery. 2005;4(12):988–1004. - PubMed
-
- Luo J, Manning BD, Cantley LC. Targeting the PI3K-Akt pathway in human cancer: rationale and promise. Cancer Cell. 2003;4(4):257–262. - PubMed
-
- Vivanco I, Sawyers CL. The phosphatidylinositol 3-Kinase AKT pathway in human cancer. Nat Rev Cancer. 2002;2(7):489–501. - PubMed
Publication types
MeSH terms
Substances
Grants and funding
LinkOut - more resources
Full Text Sources
