. 2013 Jan;48(1):44-52.
doi: 10.1165/rcmb.2012-0183OC. Epub 2012 Sep 20.

Intrapleural adenoviral delivery of human plasminogen activator inhibitor-1 exacerbates tetracycline-induced pleural injury in rabbits

Affiliations

Intrapleural adenoviral delivery of human plasminogen activator inhibitor-1 exacerbates tetracycline-induced pleural injury in rabbits

Sophia Karandashova et al. Am J Respir Cell Mol Biol. 2013 Jan.

Abstract

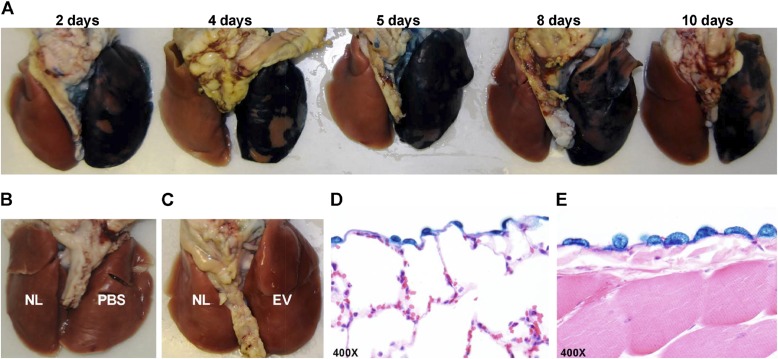
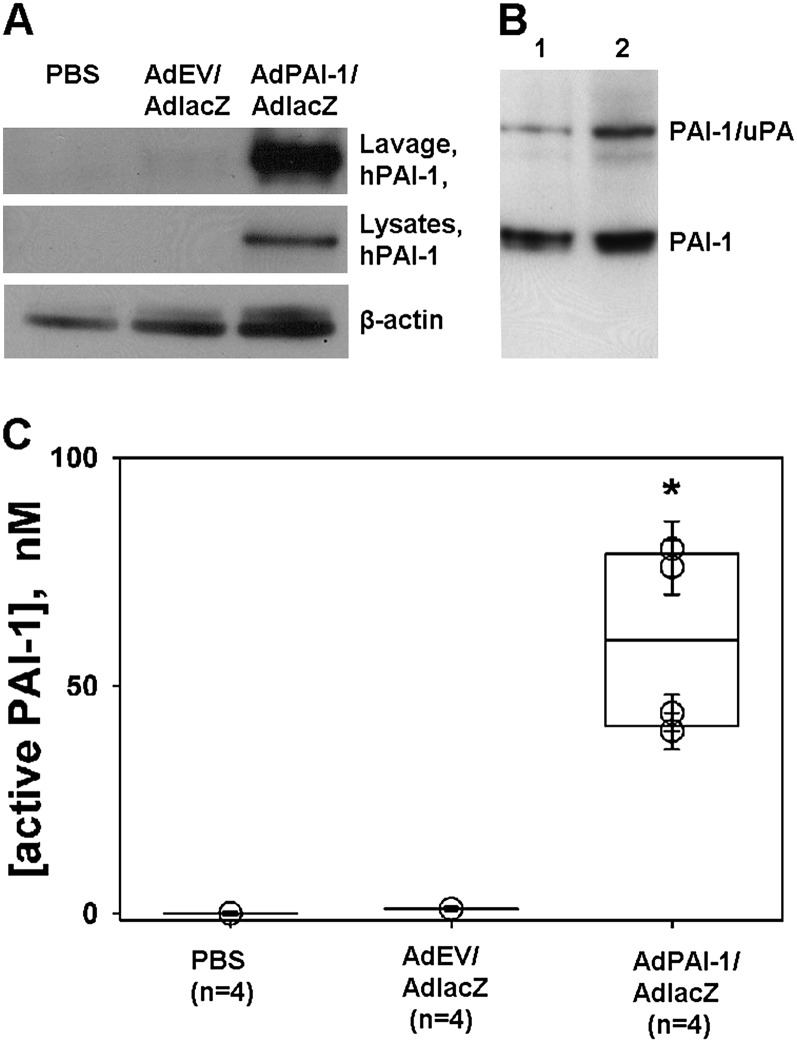
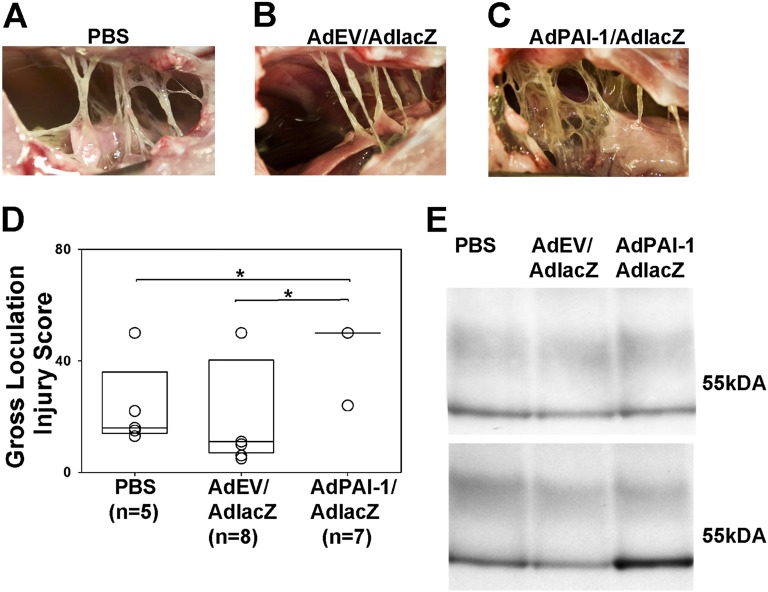
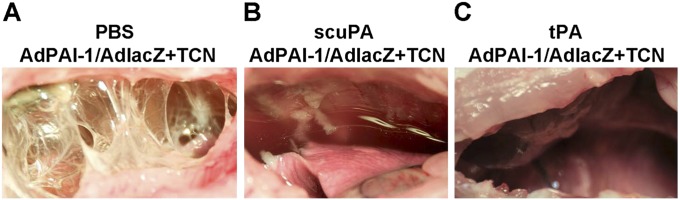
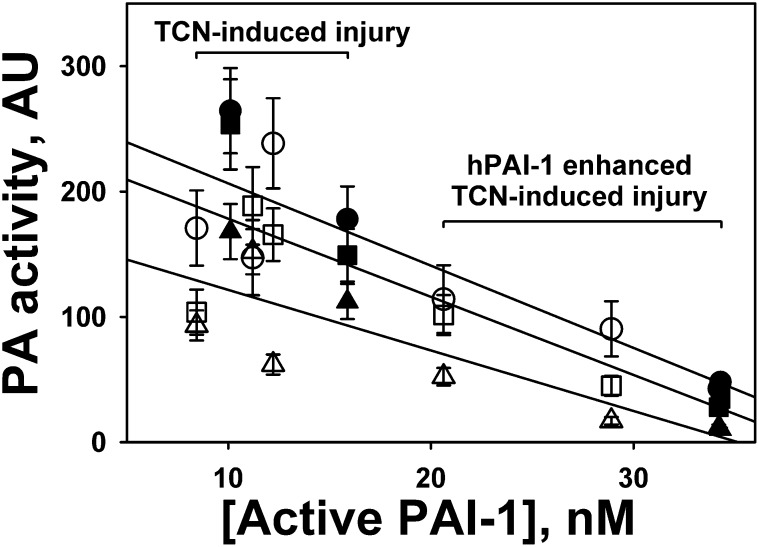
Elevated concentrations of plasminogen activator inhibitor-1 (PAI-1) are associated with pleural injury, but its effects on pleural organization remain unclear. A method of adenovirus-mediated delivery of genes of interest (expressed under a cytomegalovirus promoter) to rabbit pleura was developed and used with lacZ and human (h) PAI-1. Histology, β-galactosidase staining, Western blotting, enzymatic and immunohistochemical analyses of pleural fluids (PFs), lavages, and pleural mesothelial cells were used to evaluate the efficiency and effects of transduction. Transduction was selective and limited to the pleural mesothelial monolayer. The intrapleural expression of both genes was transient, with their peak expression at 4 to 5 days. On Day 5, hPAI-1 (40-80 and 200-400 nM of active and total hPAI-1 in lavages, respectively) caused no overt pleural injury, effusions, or fibrosis. The adenovirus-mediated delivery of hPAI-1 with subsequent tetracycline-induced pleural injury resulted in a significant exacerbation of the pleural fibrosis observed on Day 5 (P = 0.029 and P = 0.021 versus vehicle and adenoviral control samples, respectively). Intrapleural fibrinolytic therapy (IPFT) with plasminogen activators was effective in both animals overexpressing hPAI-1 and control animals with tetracycline injury alone. An increase in intrapleural active PAI-1 (from 10-15 nM in control animals to 20-40 nM in hPAI-1-overexpressing animals) resulted in the increased formation of PAI-1/plasminogen activator complexes in vivo. The decrease in intrapleural plasminogen-activating activity observed at 10 to 40 minutes after IPFT correlates linearly with the initial concentration of active PAI-1. Therefore, active PAI-1 in PFs affects the outcome of IPFT, and may be both a biomarker of pleural injury and a molecular target for its treatment.


Figures

Figure 1.
Figure 1.
Successful adenoviral transduction with adenoviral construct AdlacZ results in expression of active β-galactosidase in the rabbit pleural mesothelium, which is sustained for up to 10 days. The presence of active β-galactosidase is demonstrated by the distinct blue color of cells and tissues treated with a stain containing 5-bromo-4-chloro-3-indolyl-β-D-galactopyranoside (X-gal). (A) Lungs harvested and stained 2, 4, 5, 8, and 10 days after intrapleural transduction with the lacZ gene, delivered using the AdlacZ adenovirus, demonstrated the blue color associated with the presence of active β-galactosidase. The peak of lacZ expression was observed on Days 4–5. (B and C) Lungs of control animals treated with PBS (B), empty vector (EV) (C), or not treated (NL; in the left lungs) (B and C), lacked a blue color after staining. (D and E) Transduction, and therefore lacZ expression, was selective to the mesothelial monolayer of the visceral (D) and parietal (E) pleura, as confirmed by staining for β-galactosidase activity.
Figure 2.
Figure 2.
Human plasminogen activator inhibitor–1 (hPAI-1) in pleural lavages and rabbit pleural mesothelial cells (RPMCs) harvested from rabbits intrapleurally injected with AdPAI-1/AdlacZ. (A) hPAI-1 was detected in pleural lavages (top; Lavage, hPAI-1) and lysates (middle; lysates and hPAI-1) of RPMCs from rabbits injected with a 3:1 mixture of AdPAI-1/AdlacZ, but was not present in lavages or RPMCs of control (PBS or AdEV/AdlacZ) animals. β-actin was used as a loading control for lysates (bottom). (B) A significant fraction (20–25%) of hPAI-1 in pleural lavages was active. Pleural lavages from two animals (Lanes 1 and 2) were supplemented with exogenous human tc urokinase-type plasminogen activator (tcuPA) and incubated for 5 minutes at 4°C, and the reaction mixtures were subjected to SDS-PAGE followed by Western blot analysis of the hPAI-1 antigen. The upper band corresponds to the inhibitory PAI-1/uPA complex, which forms because of the mechanism-based inhibition of uPA by active PAI-1. The lower band corresponds to uncomplexed, latent PAI-1. (C) High levels of PAI-1 activity were detected in the pleural lavages of animals transduced with AdPAI-1/AdlacZ. Aliquots of pleural lavages were titrated with human tcuPA, as described in Materials and Methods. The concentration of active PAI-1 in each sample was calculated, assuming a stoichiometry of inhibition close to unity. A statistically significant difference (P > 0.05) between AdPAI-1/AdlacZ and the two control groups (P = 0.029 for both) is indicated by an asterisk.
Figure 3.
Figure 3.
Overexpression of hPAI-1 markedly increases the severity of tetracycline (TCN)–induced pleural fibrosis. (A–C) The typical level of injury 2 days after intrapleural injection of TCN and 5 days after intrapleural injection of PBS (A), AdEV/AdlacZ (B), or AdPAI-1/AdlacZ (C). (D) The severity of pleural injury in animals injected with PBS (n = 5), empty vector (n = 8), or AdhPAI-1 (n = 7) was evaluated as described briefly in Materials and Methods and detailed in the online supplement, and was expressed as a gross loculation injury for each animal. Data are shown as a box plot in which the 25% and 75% quartiles are indicated by the box and median values are shown as horizontal lines within the box, as previously described (31, 37). Individual scores for each animal are also shown as open circles, which overlap if more than one animal received an identical score. The fibrotic injury observed was uniformly worse (i.e., the gross loculation injury score was higher) in rabbits that received AdPAI-1/AdlacZ compared with PBS (P = 0.029) and AdEV/AdlacZ (P = 0.021). (C) This more complex pleural injury was characterized by the formation of fibrin webs and coalescent fibrinous sheets. (E) Western blot analysis of rabbit plasminogen activator inhibitor–1 (rPAI-1) (top) and hPAI-1 (bottom) antigens in pleural fluids (PFs) of animals with TCN-induced pleural injury. Whereas the concentration of rPAI-1 in the PF of all animals with TCN-induced injury was similar (top), the concentration of hPAI-1 (bottom) was markedly higher in the PF of rabbits transduced with AdPAI-1/lacZ. Monoclonal anti-human PAI-1 antibodies exhibit low-level cross-reactivity with rPAI-1 at higher concentrations.
Figure 4.
Figure 4.
Intrapleural fibrinolytic therapy of pleural fibrosis in rabbits with overexpression of hPAI-1 and TCN-induced injury. Animals transduced with AdPAI-1/AdlacZ overexpressed hPAI-1 in the pleural space, and developed pleural effusions and adhesions 2 days after TCN was administered intrapleurally (see Figure 3C). When these animals were treated with single-chain uPA (scuPA) (0.5 mg per kg) (B) or tissue-type plasminogen activator (tPA) (0.145 mg per kg) (C), most of the pleural adhesions were effectively cleared 24 hours later. In contrast, control animals treated with PBS (A) demonstrated a severe, complex organization and adhesion formation.
Figure 5.
Figure 5.
Analysis of pleural fluids after fibrinolytic therapy. Enzymographic (A, B, D, and E) and Western blot (C and F) analyses of PF from animals with TCN-induced injury (A and D) and TCN-induced injury enhanced with the mesothelial expression of hPAI-1 (B, E, C, and F). PFs were sampled before (time point 0) as well as 10, 20, and 40 minutes after intrapleural treatment with an effective therapeutic dose of scuPA (A–C) or tPA (D–F). Arrows to the right indicate positions of uPA/PAI-1 inhibitory complexes (∼ 100 kD) (I), uPA (∼ 50 kD) (II), tPA/PAI-1 inhibitory complexes (∼ 110 kD) (III), tPA (∼ 63 kD) (IV), active and latent hPAI-1 (∼ 50 kD) (V), and cleaved hPAI-1 (VI). Endogenous plasminogen activators complexed with PAI-1 were detected before treatment, at 0 minutes (A and B, and D and E, respectively). However, these time point 0 enzymographic analyses required an incubation period of 2–3 hours or 2–4 hours (2- to -4-fold or 1.7- to 5-fold, respectively) longer for the bands representing these complexes to become fully visible. (G) Active rPAI-1 in animals with TCN injury (n = 5) and active and latent hPAI-1 in animals transduced with AdPAI-1/AdlacZ followed by TCN injury (n = 4). Active PAI-1 (rabbit or total rabbit plus human, respectively) in PF, withdrawn before intrapleural fibrinolytic therapy (IPFT), was measured by titration with known amounts of tcuPA, as briefly described in Materials and Methods, and as detailed in the online supplement. Concentrations of active rPAI-1 were similar between transduced and nontransduced animals (Figure 3E, top) and among animals with TCN-induced injury (G, rPAI-1 active). Thus, the concentrations of active hPAI-1 (G, hPAI-1 active) were calculated as [hPAI-1 active] = [total PAI-1 active] − [average rPAI-1 active]. The concentrations of latent hPAI-1 (G, hPAI-1 latent) were calculated as [total hPAI-1] (measured by ELISA) minus [hPAI-1 active]. Data are presented as a box plot in which the 25% and 75% quartiles are indicated in the box, and median values are shown as horizontal lines within the box, as previously described (31, 37).
Figure 6.
Figure 6.
Intrapleural plasminogen-activating (PA) activity during fibrinolytic therapy inversely correlates with the concentration of intrapleural active PAI-1. PFs of rabbits with TCN-induced pleural injury (n = 5) and TCN-induced injury enhanced by overexpressing hPAI-1 intrapleurally (n = 4) were treated with an effective dose of scuPA (open symbols) or sctPA (solid symbols) (0.5 and 0.145 mg/kg, respectively) (37). PAI-1 activity was measured in PF collected before IPFT, as described previously (33). PA activity was measured in PF collected 10 minutes (circles), 20 minutes (squares), and 40 minutes (triangles) after IPFT, as described elsewhere (33). The average of four measurements was plotted against the concentration of active PAI-1. Solid lines represent the best fit of a linear equation to the data for 10 minutes (circles; r2 = 0.77), 20 minutes (squares; r2 = 0.71), and 40 minutes (triangles; r2 = 0.71) after IPFT.

References

    1. Grijalva CG, Zhu Y, Nuorti JP, Griffin MR. Emergence of parapneumonic empyema in the USA. Thorax 2011;66:663–668 - PMC - PubMed
    1. Strachan RE, Cornelius A, Gilbert GL, Gulliver T, Martin A, McDonald T, Nixon GM, Roseby R, Ranganathan S, Selvadurai H, et al. Bacterial causes of empyema in children, Australia, 2007–2009. Emerg Infect Dis 2011;17:1839–1845 - PMC - PubMed
    1. Finley C, Clifton J, Fitzgerald JM, Yee J. Empyema: an increasing concern in Canada. Can Respir J 2008;15:85–89 - PMC - PubMed
    1. Obando I, Munoz-Almagro C, Arroyo LA, Tarrago D, Sanchez-Tatay D, Moreno-Perez D, Dhillon SS, Esteva C, Hernandez-Bou S, Garcia-Garcia JJ, et al. Pediatric parapneumonic empyema, Spain. Emerg Infect Dis 2008;14:1390–1397 - PMC - PubMed
    1. Roxburgh CS, Youngson GG, Townend JA, Turner SW. Trends in pneumonia and empyema in Scottish children in the past 25 years. Arch Dis Child 2008;93:316–318 - PubMed

Publication types