. 2012 Aug 14;24(15):2952-2964.
doi: 10.1021/cm301148d. Epub 2012 Jul 19.

Composition-structure relationships in the Li-ion battery electrode material LiNi(0.5)Mn(1.5)O(4)

Affiliations

Composition-structure relationships in the Li-ion battery electrode material LiNi(0.5)Mn(1.5)O(4)

Jordi Cabana et al. Chem Mater. .

Abstract

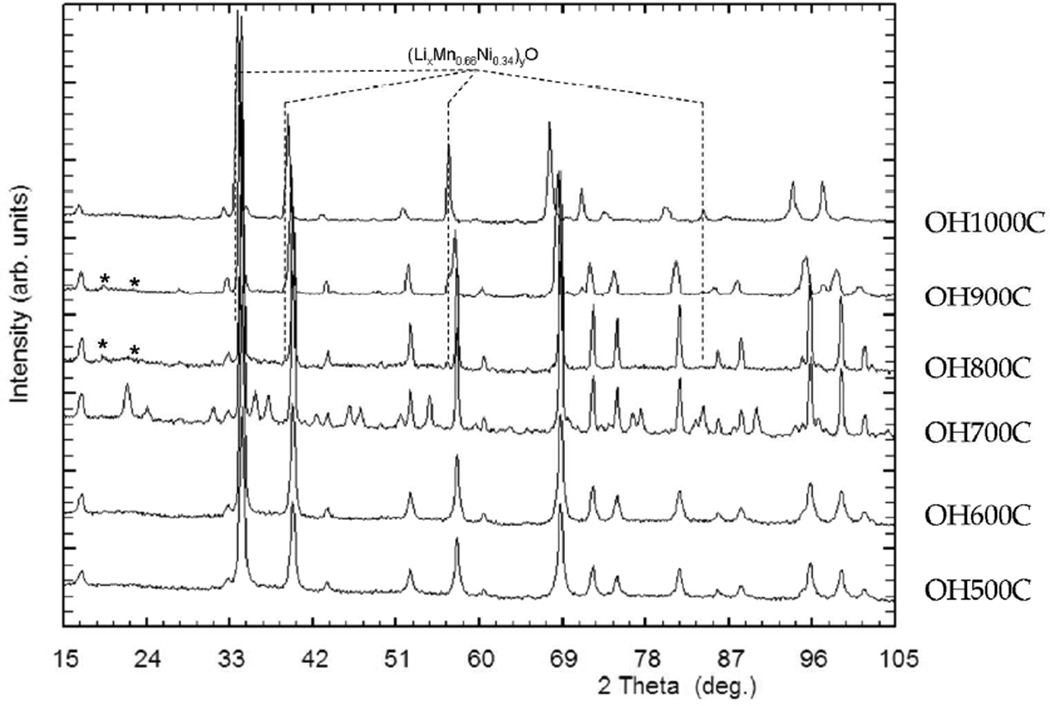
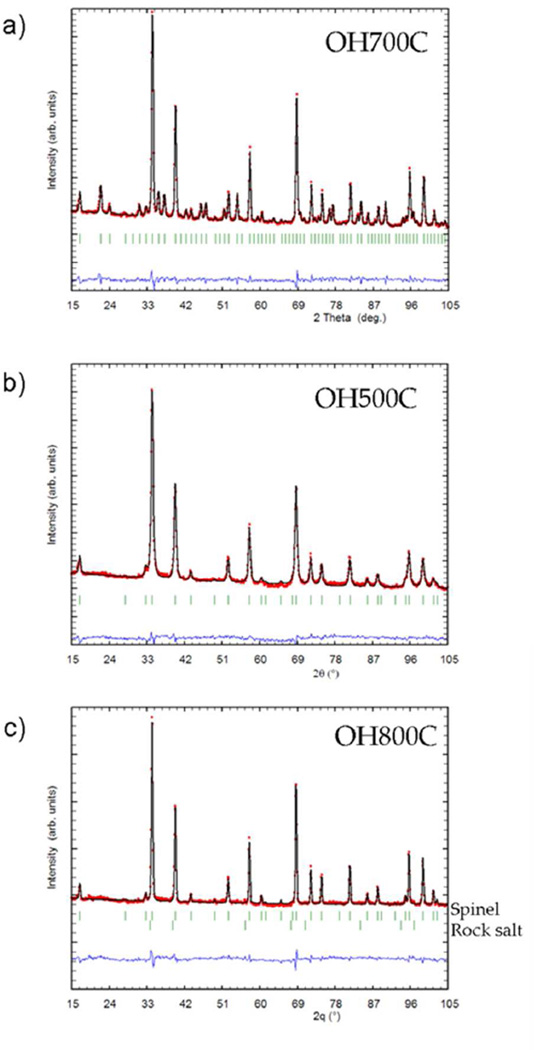
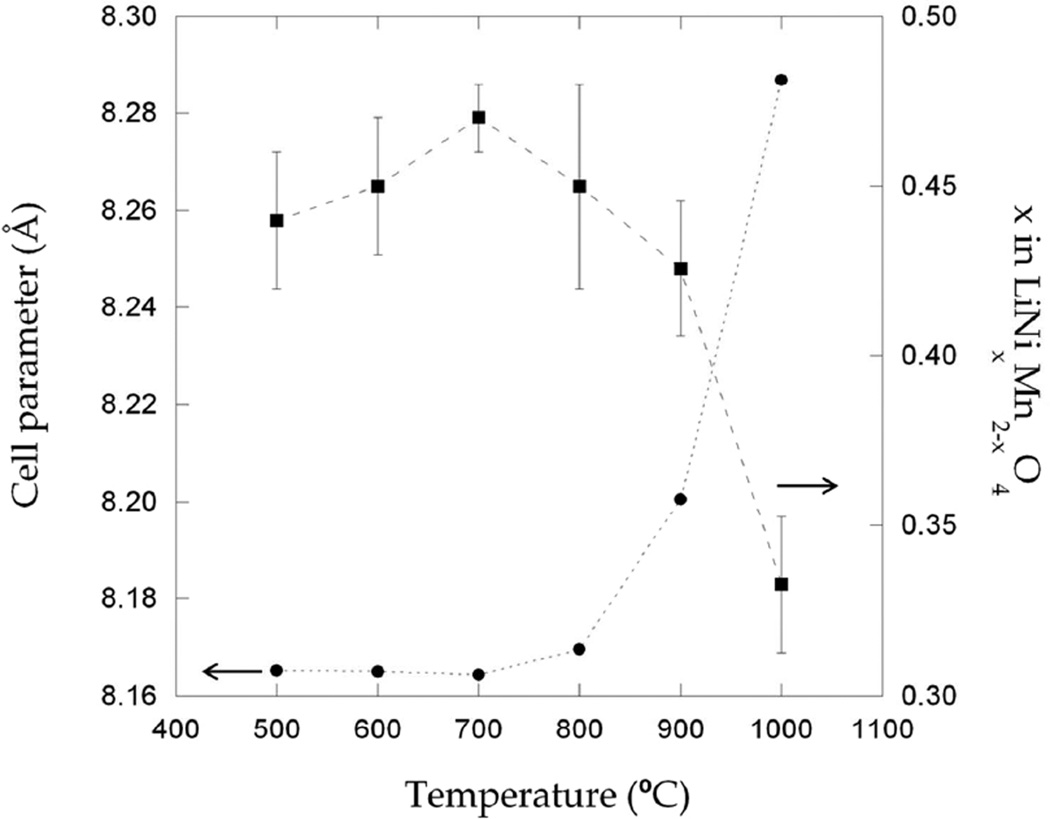
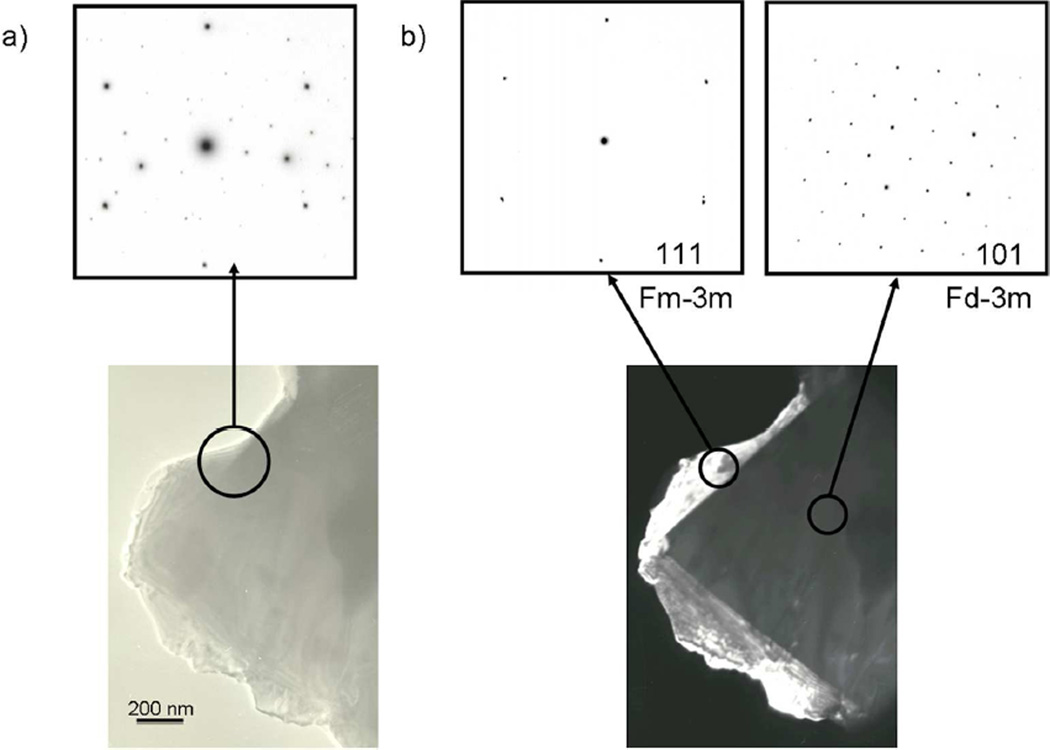
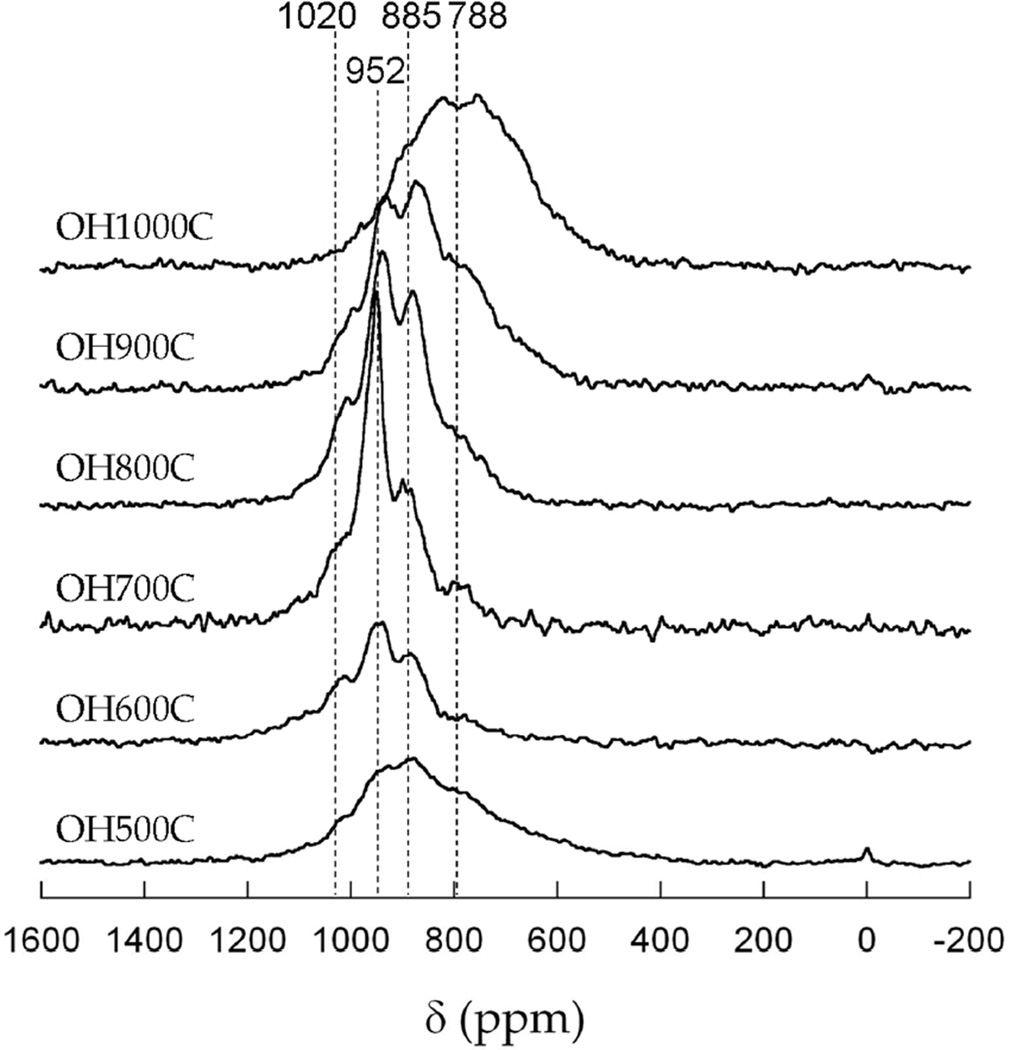
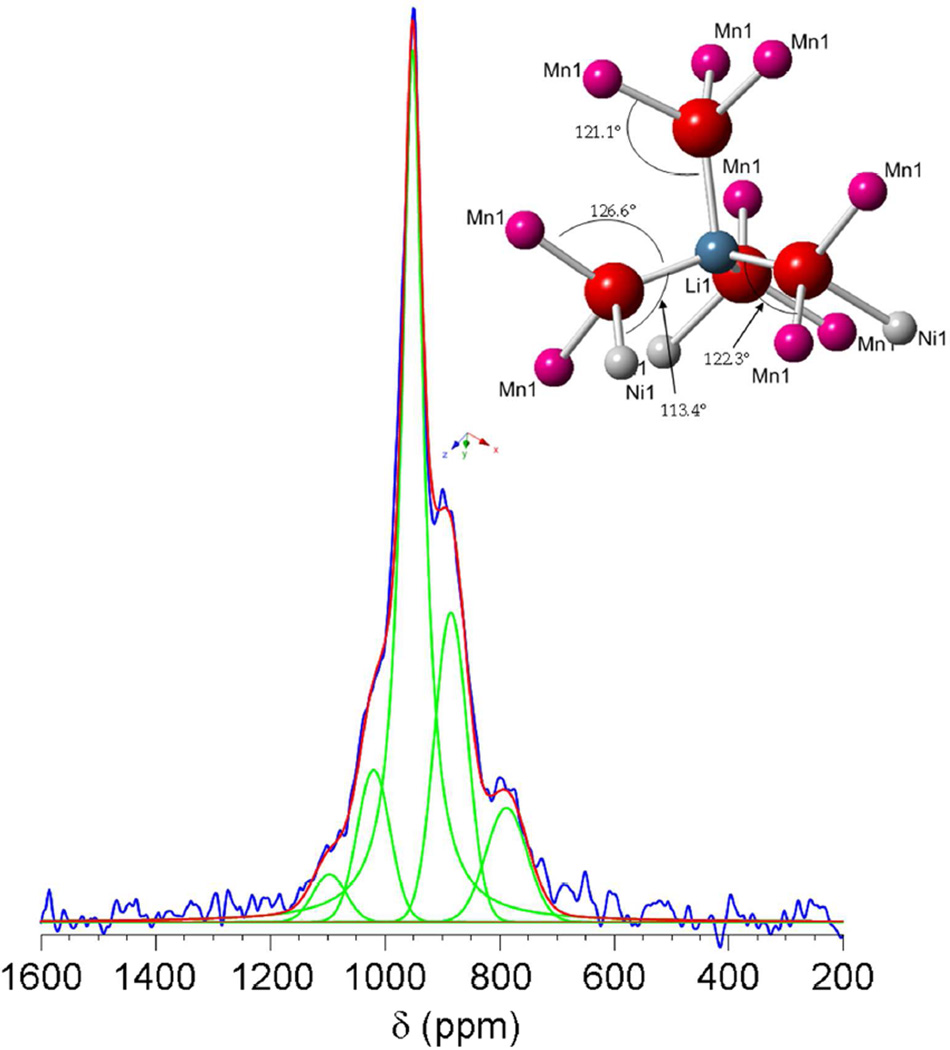
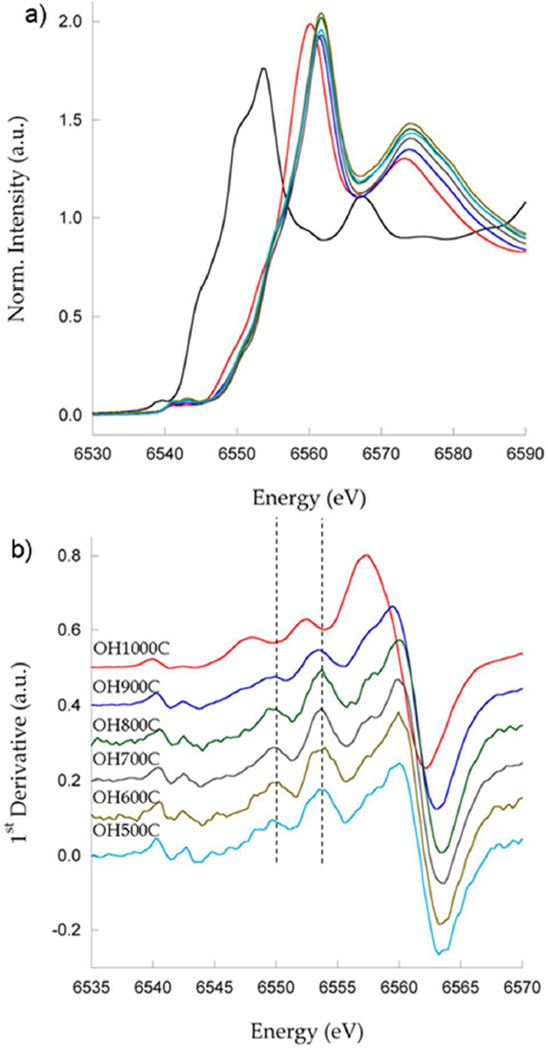
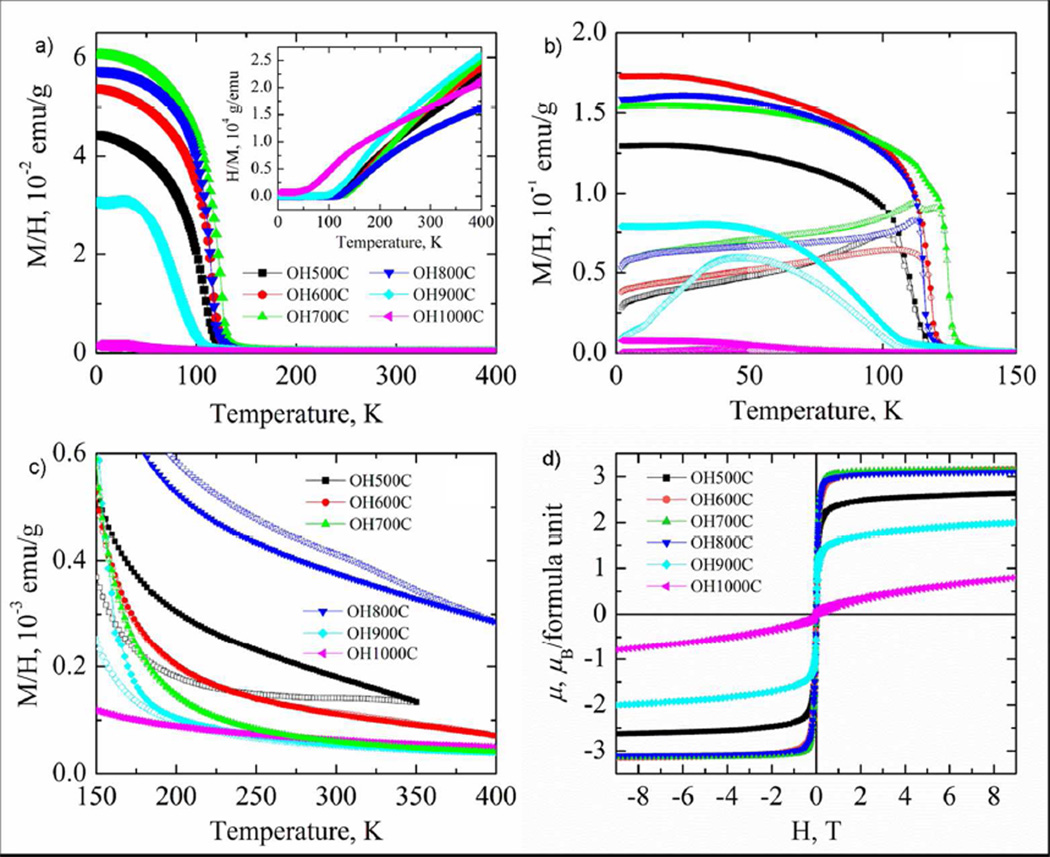
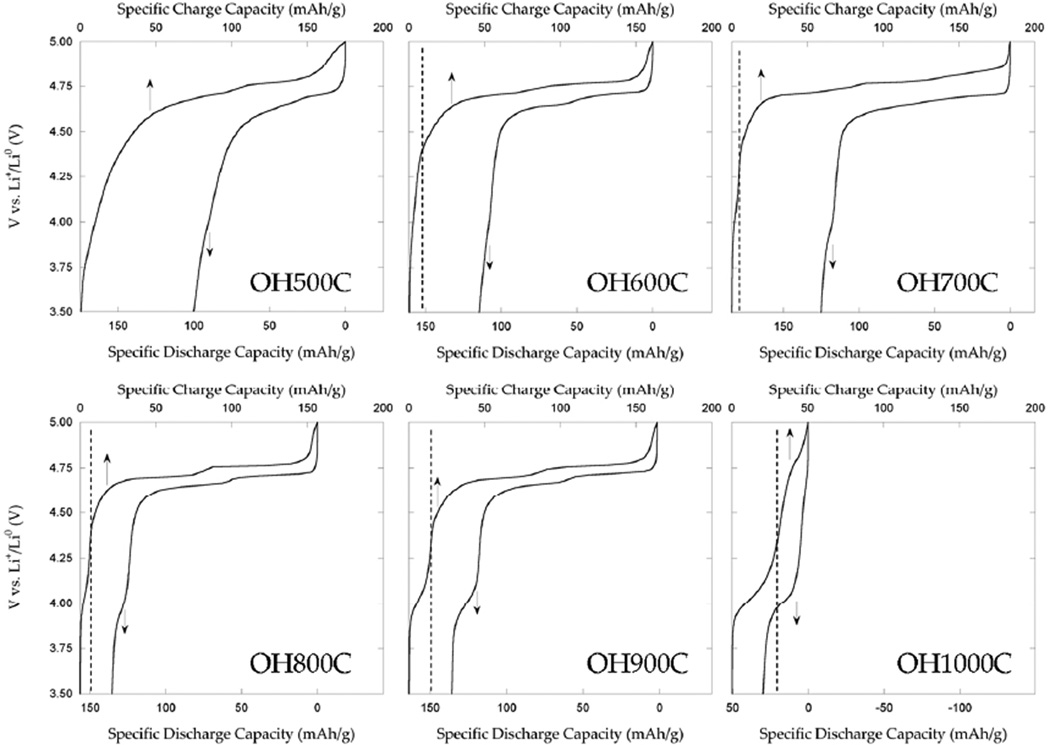
A study of the correlations between the stoichiometry, secondary phases and transition metal ordering of LiNi(0.5)Mn(1.5)O(4) was undertaken by characterizing samples synthesized at different temperatures. Insight into the composition of the samples was obtained by electron microscopy, neutron diffraction and X-ray absorption spectroscopy. In turn, analysis of cationic ordering was performed by combining neutron diffraction with Li MAS NMR spectroscopy. Under the conditions chosen for the synthesis, all samples systematically showed an excess of Mn, which was compensated by the formation of a secondary rock salt phase and not via the creation of oxygen vacancies. Local deviations from the ideal 3:1 Mn:Ni ordering were found, even for samples that show the superlattice ordering by diffraction, with different disordered schemes also being possible. The magnetic behavior of the samples was correlated with the deviations from this ideal ordering arrangement. The in-depth crystal-chemical knowledge generated was employed to evaluate the influence of these parameters on the electrochemical behavior of the materials.


Figures

Figure 1
Figure 1
Neutron powder diffraction pattern of the samples synthesized in this study, as indicated. Resolved reflections of a rocksalt-type secondary phase are indicated by broken lines.
Figure 2
Figure 2
Neutron powder diffraction pattern (small circles) showing the final Rietveld fit (solid line), with the difference plot below for samples a) OH700C, b) OH500C and c) OH800C.
Figure 3
Figure 3
Variation of the cell parameter and × in LiNixMn2-xO4 obtained from Rietveld refinements of neutron diffraction (ND) data with annealing temperature.
Figure 4
Figure 4
a) Bright field image of a particle containing different crystallites. The inset shows the corresponding electron diffraction pattern, which results from the overlapping patterns of each crystallite. b) Dark-field image of the particle formed from a (2, -2, 0) reflection that could be indexed to a rock salt-type structure. The insets show the individual zone axis of each crystallite : <111> zone axis for the rock salt phase and <101> zone axis for the spinel phase.
Figure 5
Figure 5
6Li MAS NMR spectra of the samples synthesized in this study, as indicated. Representative shifts are provided. The existence of minor peaks at 0 ppm in some samples is indicative of the existence of very minor impurities of diamagnetic lithium salts.
Figure 6
Figure 6
Deconvolution of the 6Li MAS NMR spectrum of OH700C. See text for details on experimental constraints. The best fit was achieved by using a Lorentzian function for the most intense peak and the largest line broadening for the peak at 788 ppm. Blue: experimental data; red: additive theoretical spectrum; green: deconvoluted peaks. The inset represents the lithium local environment in an ideally ordered spinel structure with formula LiNi0.5Mn1.5O4. Relevant bond angles are provided.
Figure 7
Figure 7
Ni K edge XANES data for the samples prepared in this study, as indicated. a) experimental spectra, b) first derivative and color code, c) comparison of OH900C and OH1000C with the spectrum of a NiO standard.
Figure 8
Figure 8
Mn K edge XANES data for the samples prepared in this study, as indicated. a) experimental spectra with a MnO standard (black), b) first derivative and color code.
Figure 9
Figure 9
a) Temperature dependences of the magnetic susceptibility for the samples synthesized in this study, as indicated. The inset shows the reciprocal susceptibility. b) and c) Temperature dependences of field-cooled (solid symbols) and zero-field cooled (open symbols) magnetic susceptibility over the low- and high-temperature region, respectively, for LiNi0.5Mn1.5O4 samples synthesized at various temperatures. d) Magnetization curves at 2 K of LiNi0.5Mn1.5O4 prepared at various temperatures.
Figure 10
Figure 10
First cycle of lithium metal half-cells containing the samples synthesized in this study, as indicated, as positive electrodes, cycled at C/10.
Figure 11
Figure 11
Specific discharge capacity vs. cycle number of lithium cells containing the samples synthesized in this study, as positive electrodes, cycled at C/10. Inverted triangles: OH500C; triangles: OH600C; diamonds: OH700C; squares: OH800C; circles: OH900C.

References

    1. Wagner FT, Lakshmanan B, Mathias MF. J. Phys. Chem. Lett. 2010;1:2204–2219.
    1. Yang Z, Zhang J, Kintner-Meyer MCW, Lu X, Choi D, Lemmon JP, Liu J. Chem. Rev. 2011;111:3577–3613. - PubMed
    1. Armand M, Tarascon JM. Nature. 2008;451:652–657. - PubMed
    1. Amine K, Tukamoto H, Yasuda H, Fujita Y. J. Electrochem. Soc. 1996;143:1607–1613.
    1. Zhong QM, Bonakdarpour A, Zhang MJ, Gao Y, Dahn JR. J. Electrochem. Soc. 1997;144:205–213.

LinkOut - more resources