. 2012 Jun;5(2):155-164.
doi: 10.1007/s12195-012-0223-1.

Mechanical tension modulates local and global vesicle dynamics in neurons

Affiliations

Mechanical tension modulates local and global vesicle dynamics in neurons

W W Ahmed et al. Cell Mol Bioeng. 2012 Jun.

Abstract

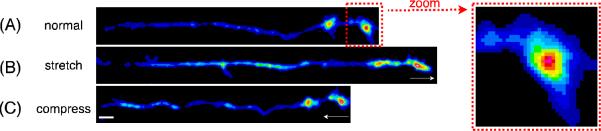
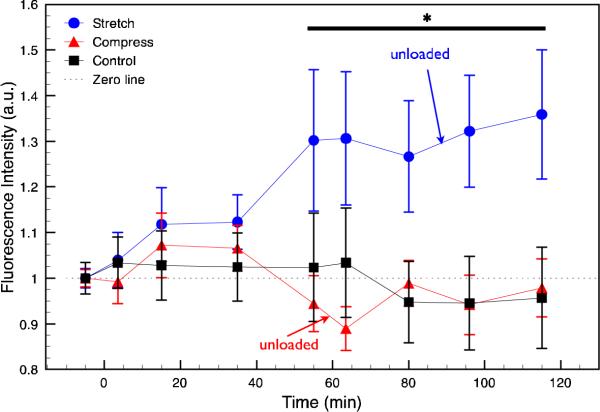
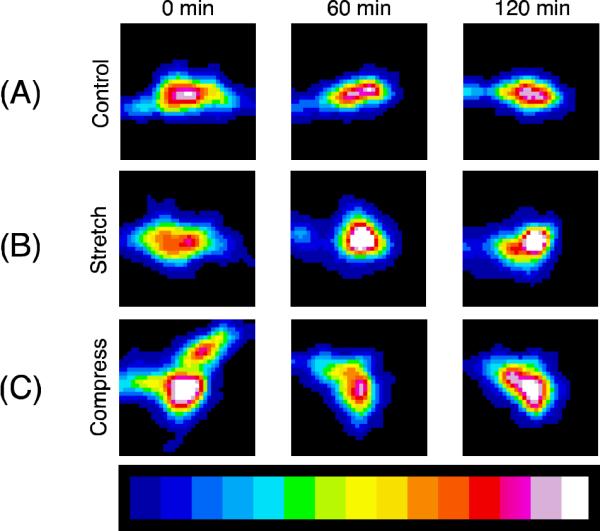
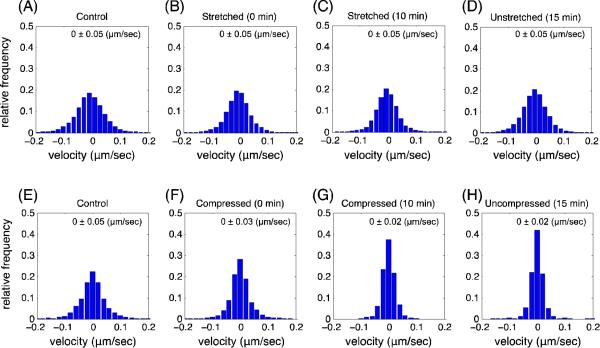
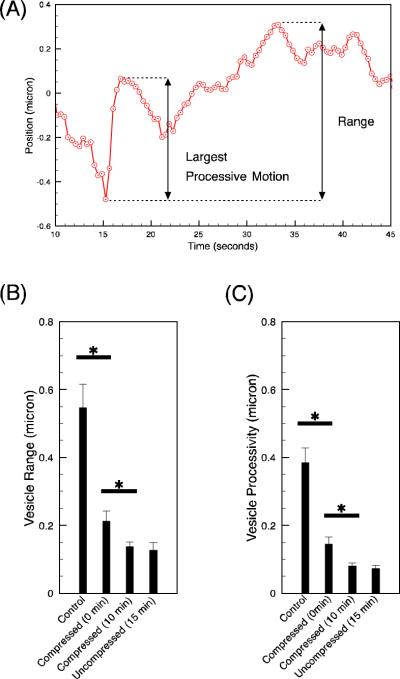
Growing experimental evidence suggests that mechanical tension plays a significant role in determining the growth, guidance, and function of neurons. Mechanical tension in axons contributes to neurotransmitter clustering at the Drosophila neuromuscular junction (NMJ) and is actively regulated by neurons both in vitro and in vivo. In this work, we applied mechanical strain on in vivo Drosophila neurons and in vitro Aplysia neurons and studied their vesicle dynamics by live-imaging. Our experiments show that mechanical stretch modulates the dynamics of vesicles in two different model systems: (1) The global accumulation of synaptic vesicles (SV) at the Drosophila NMJ and (2) the local motion of individual large dense core vesicles (LDCV) in Aplysia neurites. Specifically, a sustained stretch results in enhanced SV accumulation in the Drosophila NMJ. This increased SV accumulation occurs in the absence of extracellular Ca(2+), plateaus after approximately 50 min, and persists for at least 30 min after stretch is reduced. On the other hand, mechanical compression in Aplysia neurites immediately disrupts LDCV motion, leading to decreased range and processivity. This impairment of LDCV motion persists for at least 15 min after tension is restored. These results show that mechanical stretch modulates both local and global vesicle dynamics and strengthens the notion that tension serves a role in regulating neuronal function.


Figures

FIGURE 1
FIGURE 1
Axons of Drosophila motor neuron under mechanical strain where the color map represents the fluorescent intensity, blue indicates low synaptotagmin and red indicates high. (A) A control axon is shown on the PDMS surface. The inset on the right shows a 10 μm by 10 μm region near the presynaptic terminal where a 2.5 μm by 2.5 μm region was used to quantify synaptic vesicle accumulation. (B) An axon is shown stretched by substrate deformation, notice the straightness of the axon (increased tension). (C) An axon is shown compressed by substrate deformation, notice the axon is squiggly (decreased tension). Note that images in (A) and (B) show the same axon, while the image in (C) is a different axon. (scale bar = 5 μm) (Wylie Ahmed)
FIGURE 2
FIGURE 2
Synaptic vesicle accumulation (in terms of fluorescent intensity) at the Drosophila NMJ as a function of time. Control samples (n=10) show no significant change in synaptic vesicle accumulation. When axons are stretched (n=8), increased accumulation by 30%_15 is observed after approximately 50 min and the effect persists for at least 30 min after stretch is removed. In compressed axons (n=8), no significant change occurs in accumulation during compression or after it is removed. Statistical significance evaluated by Student's t-test (P<0.01) and denoted in figure by *. (error bars = SEM) (Wylie Ahmed)
FIGURE 3
FIGURE 3
Snapshots of representative Drosophila presynaptic terminals during the experiment. Blue indicates low fluorescence intensity of synaptic vesicles and white indicates high intensity. (A) Control samples show no significant change in vesicle clustering throughout the entire experiment. (B) Increased tension by stretch showed increased accumulation in the 60 min frame and this effect persists until the end of the experiment at 120 min (stretch was removed at 90 min). (C) Decreased tension by compression showed fluctuations in vesicle accumulation, but the amount of vesicles was similar to that of the control throughout the experiment. (Each image is 10 μm × 10 μm). (Wylie Ahmed)
FIGURE 4
FIGURE 4
Histograms showing the velocity distribution of LDCVs in Aplysia neurons. (AD) When Aplysia neurons are stretched, the velocity distribution of the LDCVs remains the same throughout the time-course of the experiment. Mean_standard deviation are indicated in the charts and were not found to be statistically different. This shows that increased tension in Aplysia neurites does not affect the velocity distribution of LDCVs. (EH) When Aplysia neurons are compressed, the velocity distribution of the LDCVs narrows in width and increases in magnitude throughout the experiment. Mean _ standard deviation are indicated in the charts and velocity distributions were found to be statistically different (Student's t-test, P<0.01). This shows that decreased tension in Aplysia neurites leads to disrupted motion of LDCVs. (Wylie Ahmed)
FIGURE 5
FIGURE 5
Motion of an individual Aplysia vesicle as a function of time. Vesicles in control samples show a large motion back and forth about a central region. Immediately after compression is applied the vesicle motion decreases dramatically (blue) and continues to decrease while compression is held (pink) for over 10 min. Even after removal of compression (neurite tension is restored), vesicle motion does not recover (red) for over 15 min. In this plot the motion of one representative vesicle is shown. (Wylie Ahmed)
FIGURE 6
FIGURE 6
Range and processivity of vesicles in Aplysia neurons. (A) A representative plot showing the range and largest processive motion of a single vesicle. (B) Vesicle range of motion was approximately 550 nm in the control samples. Mechanical compression caused an immediate decrease to 200 nm and the range continued to decrease to 140 nm. (C) In control samples the largest processive motion of vesicles was approximately 380 nm. This decreased to 140 nm immediately after compression and continued to decrease to 80 nm. In both cases, the effect persists for over 15 min after compression was removed. Statistical significance evaluated by Student's t-test (P<0.05) and denoted in figure by *. (error bar = SEM) (Wylie Ahmed)
FIGURE 7
FIGURE 7
A connection between vesicle transport and accumulation. (A) A schematic diagram of an axon in its normal resting state. Microtubules (green) extend along the axon and are crosslinked (black) together to form a network. Vesicles (blue) are attached to molecular motors (brown) that transport them along the microtubule network and some accumulate in the actin scaffolding (red) at the synapse. (B) Microtubules depolymerize under compression leading to disrupted vesicle transport while maintaining normal vesicle accumulation at the synapse. (C) A stretched axon exhibits increased vesicle accumulation at the synapse due to tension induced actin polymerization creating more vesicle binding sites. (Wylie Ahmed)

References

    1. Abramoff MD, Magalhaes PJ, Ram SJ. Image processing with ImageJ. Biophotonics International. 2004;11(7):36–41.
    1. Ahmed WW, Kural MH, Saif TA. A novel platform for in situ investigation of cells and tissues under mechanical strain. Acta Biomaterialia. 2010;6(8):2979–90. - PMC - PubMed
    1. Ayali A. The function of mechanical tension in neuronal and network development. Integr. Biol. 2010;2(4):178–82. - PubMed
    1. Bernal R, Pullarkat PA, Melo F. Mechanical properties of axons. Phys Rev Lett. 2007;99(1):018301. - PubMed
    1. Bixby JL. Ultrastructural observations on synapse elimination in neonatal rabbit skeletal muscle. J Neurocytol. 1981;10(1):81–100. - PubMed

LinkOut - more resources