. 2012;64(7):1112-21.
doi: 10.1080/01635581.2012.712738. Epub 2012 Sep 24.

The attenuation of early benzo(a)pyrene-induced carcinogenic insults by diallyl disulfide (DADS) in MCF-10A cells

Affiliations

The attenuation of early benzo(a)pyrene-induced carcinogenic insults by diallyl disulfide (DADS) in MCF-10A cells

Yasmeen M Nkrumah-Elie et al. Nutr Cancer. 2012.

Abstract

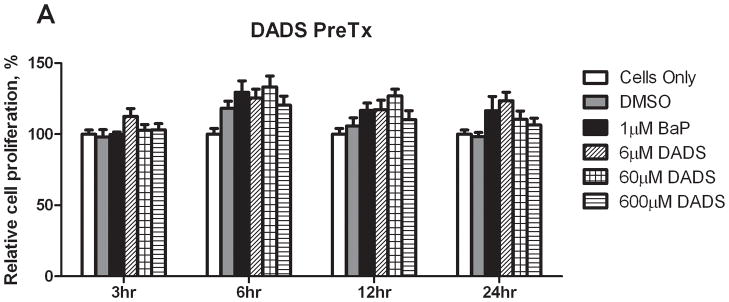
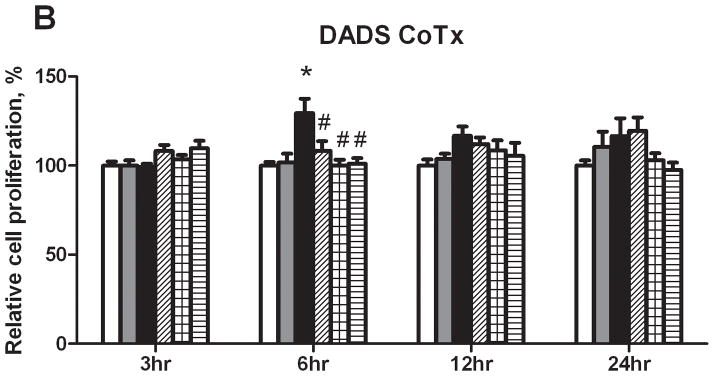
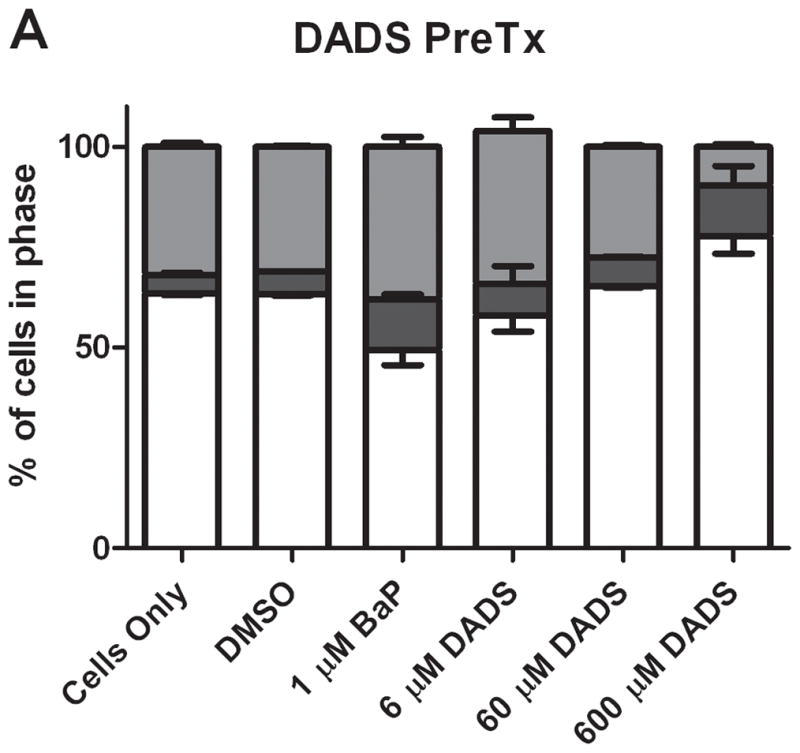
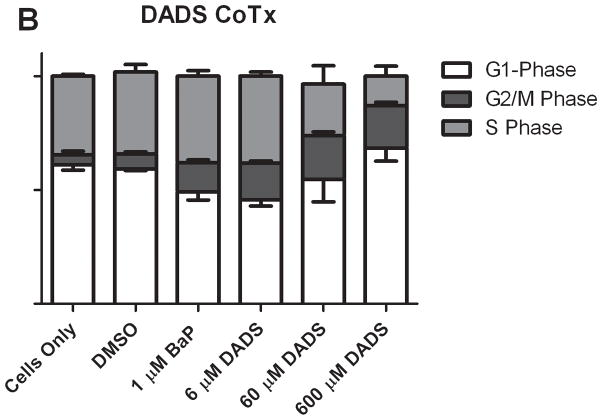
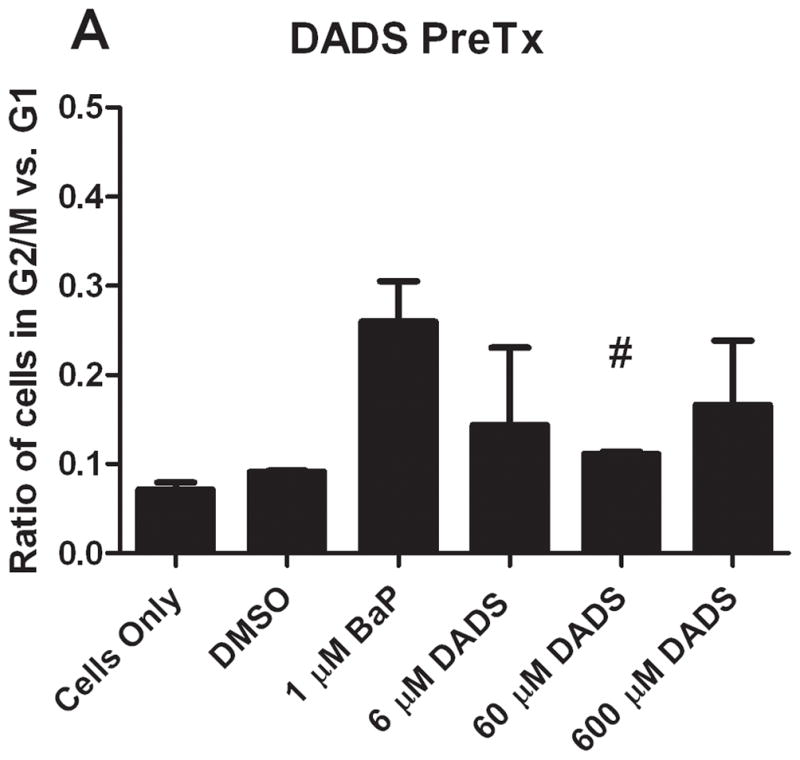
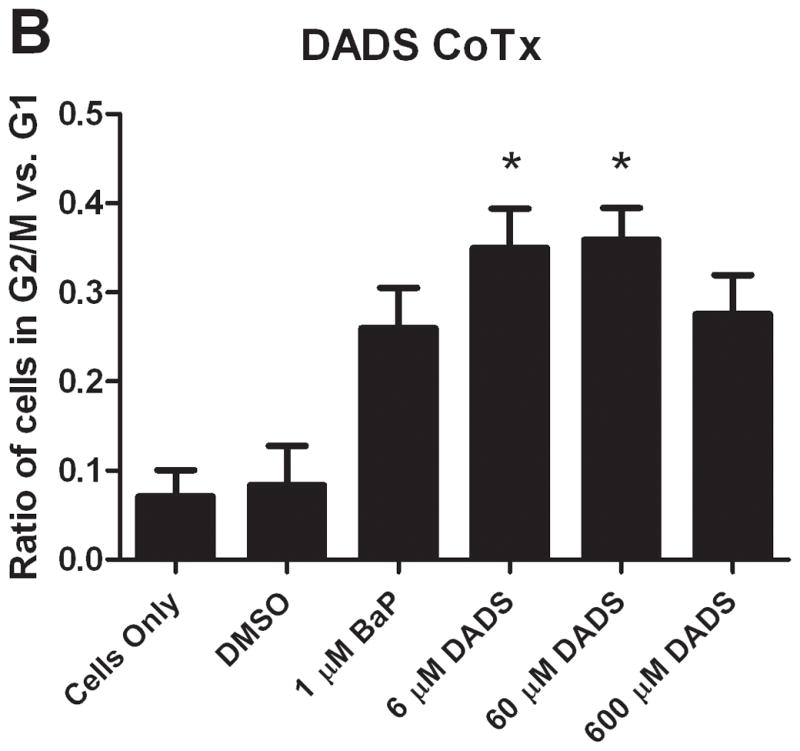
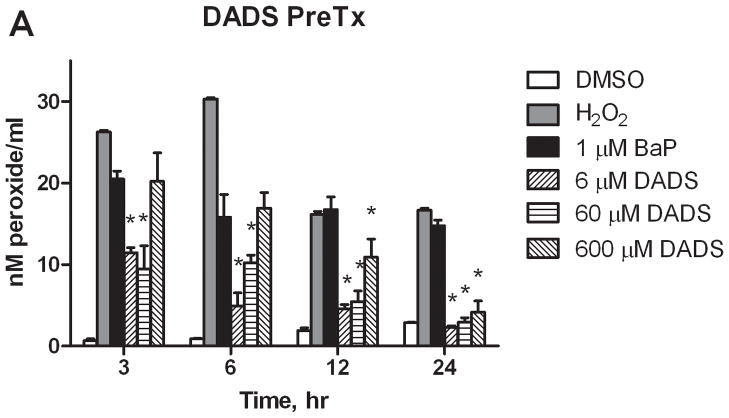
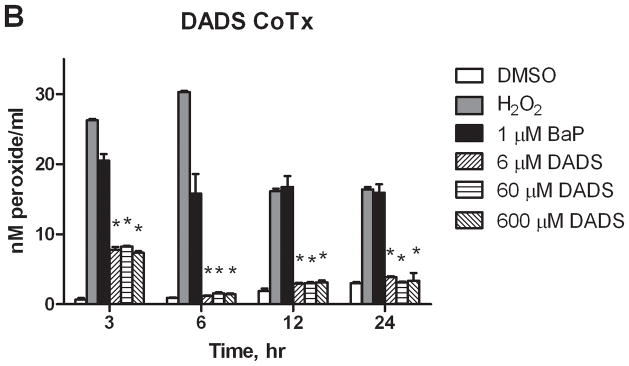
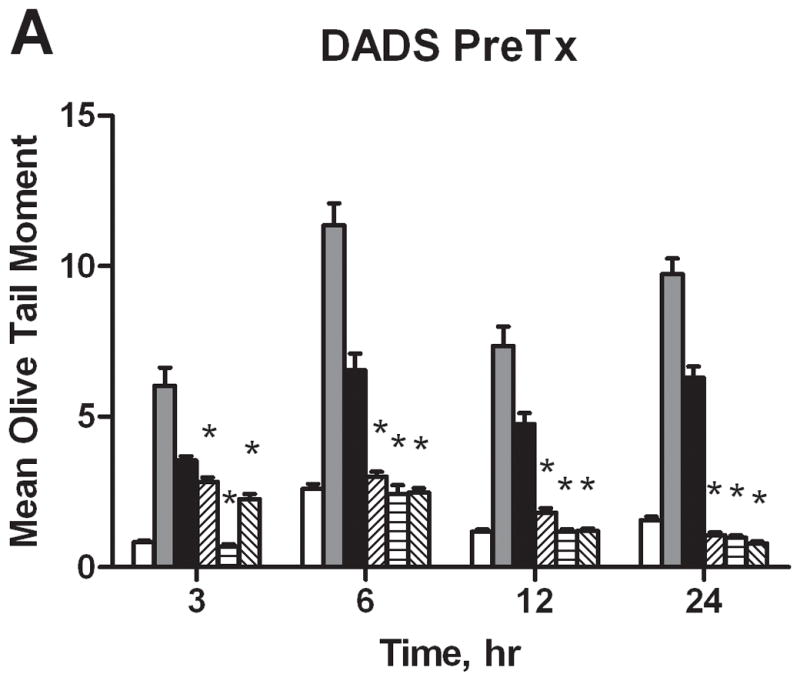
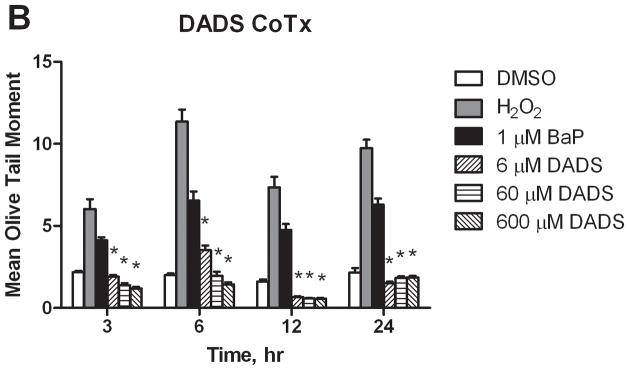
Diallyl disulfide (DADS), a garlic organosulfur compound, has been researched as a cancer prevention agent; however, the role of DADS in the suppression of cancer initiation in nonneoplastic cells has not been elucidated. To evaluate DADS inhibition of early carcinogenic events, MCF-10A cells were pretreated (PreTx) with DADS followed by the ubiquitous carcinogen benzo(a)pyrene (BaP), or cotreated (CoTx) with DADS and BaP for up to 24 h. The cells were evaluated for changes in cell viability/proliferation, cell cycle, induction of peroxide formation, and DNA damage. BaP induced a statistically significant increase in cell proliferation at 6 h, which was attenuated with DADS CoTx. PreTx with 6 and 60 μM of DADS inhibited BaP-induced G2/M arrest by 68% and 78%, respectively. DADS, regardless of concentration or method, inhibited BaP-induced extracellular aqueous peroxide formation within 24 h. DADS attenuated BaP-induced DNA single-strand breaks at all time points through both DADS Pre- and CoTx, with significant inhibition for all treatments sustained after 6 h. DADS was effective in inhibiting BaP-induced cell proliferation, cell cycle transitions, reactive oxygen species, and DNA damage in a normal cell line, and thus may inhibit environmentally induced breast cancer initiation.


Figures

Figure 1
Figure 1
Relative cell proliferation of cells treated with BaP and DADS. MCF-10A cells were pretreated with DADS for four hours followed by the addition of 1 μM BaP (A) or treated concomitantly with 1 μM BaP and DADS (B). To determine cell viability, the MTS solution was applied to the cells for 2–3 hours and analyzed at an absorbance of 490nm. The absorbance of each treatment group was normalized relative to the cells only control for 100% cell viability. The graphs represent the average relative cell proliferation in quadruplicate for N=3, +/− the SEM (* and # indicate a P<0.05 significant difference from the DMSO control and the 1 μM BaP only control, respectively).
Figure 1
Figure 1
Relative cell proliferation of cells treated with BaP and DADS. MCF-10A cells were pretreated with DADS for four hours followed by the addition of 1 μM BaP (A) or treated concomitantly with 1 μM BaP and DADS (B). To determine cell viability, the MTS solution was applied to the cells for 2–3 hours and analyzed at an absorbance of 490nm. The absorbance of each treatment group was normalized relative to the cells only control for 100% cell viability. The graphs represent the average relative cell proliferation in quadruplicate for N=3, +/− the SEM (* and # indicate a P<0.05 significant difference from the DMSO control and the 1 μM BaP only control, respectively).
Figure 2
Figure 2
Results of cell cycle analysis of MCF-10A cells treated with BaP and DADS. MCF-10A cells were either PreTx with DADS for four hours, followed by treatment with 1 μM BaP for 24 hours (A) or CoTx with DADS and BaP for 24 hours (B). The cells were fixed in ethanol, stained with propidium iodide, and analyzed by flow cytometry. The values represent the average percent of cells in each phase, G1, G2/M, and S +/− SEM.
Figure 2
Figure 2
Results of cell cycle analysis of MCF-10A cells treated with BaP and DADS. MCF-10A cells were either PreTx with DADS for four hours, followed by treatment with 1 μM BaP for 24 hours (A) or CoTx with DADS and BaP for 24 hours (B). The cells were fixed in ethanol, stained with propidium iodide, and analyzed by flow cytometry. The values represent the average percent of cells in each phase, G1, G2/M, and S +/− SEM.
Figure 3
Figure 3
The ratio of cells in G2/M and G1 phases at 24 hours. The bars indicate the average percentage of cells in G2/M divided by the average percentage of cells in G1 for DADS PreTx (A) and DADS CoTx (B), +/− SEM (* indicates a P<0.05 significant difference from the DMSO control, and # indicates a P<0.05 significant difference from the 1 μM BaP only control).
Figure 3
Figure 3
The ratio of cells in G2/M and G1 phases at 24 hours. The bars indicate the average percentage of cells in G2/M divided by the average percentage of cells in G1 for DADS PreTx (A) and DADS CoTx (B), +/− SEM (* indicates a P<0.05 significant difference from the DMSO control, and # indicates a P<0.05 significant difference from the 1 μM BaP only control).
Figure 4
Figure 4
Inhibition of BaP-induced aqueous peroxide formation by DADS. MCF-10A cells were exposed to a pretreatment of DADS followed by 1 μM BaP (A), or with a concomitant combination of 1 μM BaP and DADS (B). The results deem the average aqueous peroxides, +/−SEM, as detected by the PeroxiDetect Kit in triplicate for N=3. (* indicates a P<0.01 significant difference from the DMSO control).
Figure 4
Figure 4
Inhibition of BaP-induced aqueous peroxide formation by DADS. MCF-10A cells were exposed to a pretreatment of DADS followed by 1 μM BaP (A), or with a concomitant combination of 1 μM BaP and DADS (B). The results deem the average aqueous peroxides, +/−SEM, as detected by the PeroxiDetect Kit in triplicate for N=3. (* indicates a P<0.01 significant difference from the DMSO control).
Figure 5
Figure 5
DNA strand breaks resulting from BaP and DADS treatment of MCF-10A cells. DADS Inhibits BaP-induced DNA damage as demonstrated by Comet assay. MCF-10A cells were treated MCF-10A cells were exposed to a PreTx of DADS followed by 1 μM BaP (A), or with a CoTx of 1 μM BaP and DADS (B). The results demonstrate the mean olive tail moment (OTM), as an indicator of DNA damage, +/− SEM for 150 cells for N=3. (* indicates a P<0.05 significant difference from the DMSO control).
Figure 5
Figure 5
DNA strand breaks resulting from BaP and DADS treatment of MCF-10A cells. DADS Inhibits BaP-induced DNA damage as demonstrated by Comet assay. MCF-10A cells were treated MCF-10A cells were exposed to a PreTx of DADS followed by 1 μM BaP (A), or with a CoTx of 1 μM BaP and DADS (B). The results demonstrate the mean olive tail moment (OTM), as an indicator of DNA damage, +/− SEM for 150 cells for N=3. (* indicates a P<0.05 significant difference from the DMSO control).

References

    1. Block E. The chemistry of garlic and onions. Sci Am. 1985;252:94–99. - PubMed
    1. Minami T, Boku T, Inada K, Morita M, Okazaki Y. Odor components of human breath after the ingestion of grated raw garlic. J Food Sci. 1989;54:763–765.
    1. Corzo-Martinez M, Corzo N, Villamiel M. Biological properties of onions and garlic. Trends in Food Sci Technol. 2007;18:609–625.
    1. Iciek M, Kwiecien I, Wlodek L. Biological properties of garlic and garlic-derived organosulfur compounds. Environ Mol Mutagen. 2009;50:247–265. - PubMed
    1. Tansey MR, Appleton JA. Inhibition of fungal growth by garlic extract. Mycologia. 1975;67:409–413. - PubMed

Publication types

LinkOut - more resources