. 2012 Dec 1;590(23):6013-26.
doi: 10.1113/jphysiol.2012.241307. Epub 2012 Sep 24.

Dietary iodide controls its own absorption through post-transcriptional regulation of the intestinal Na+/I- symporter

Affiliations

Dietary iodide controls its own absorption through post-transcriptional regulation of the intestinal Na+/I- symporter

Juan Pablo Nicola et al. J Physiol. .

Abstract

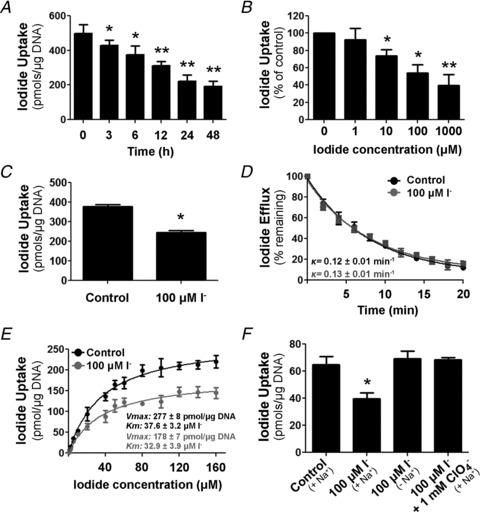
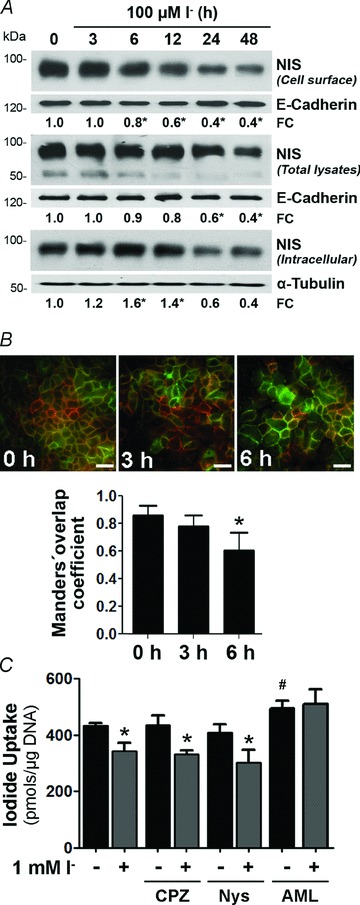
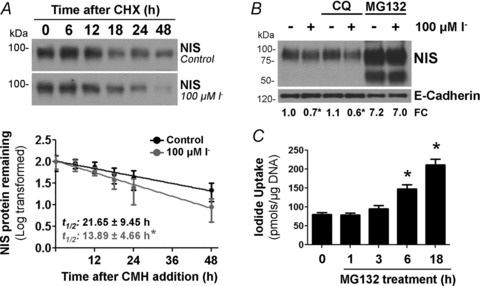
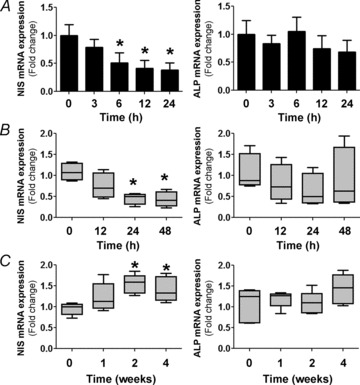
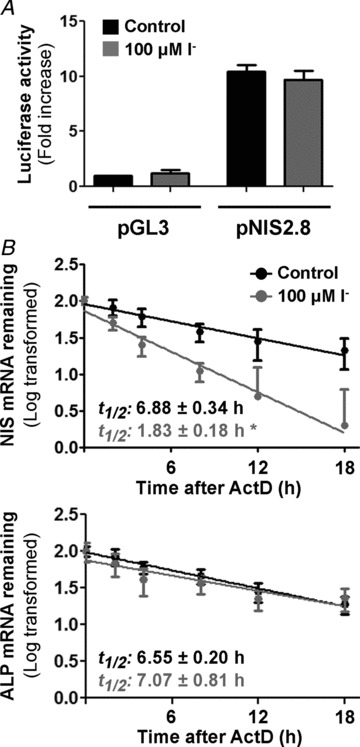
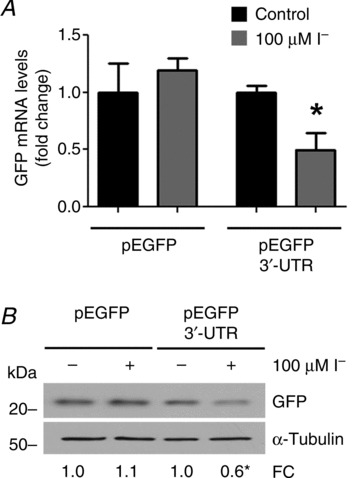
Dietary I(-) absorption in the gastrointestinal tract is the first step in I(-) metabolism. Given that I(-) is an essential constituent of the thyroid hormones, its concentrating mechanism is of significant physiological importance. We recently described the expression of the Na(+)/I(-) symporter (NIS) on the apical surface of the intestinal epithelium as a central component of the I(-) absorption system and reported reduced intestinal NIS expression in response to an I(-)-rich diet in vivo. Here, we evaluated the mechanism involved in the regulation of NIS expression by I(-) itself in enterocytes. Excess I(-) reduced NIS-mediated I(-) uptake in IEC-6 cells in a dose- and time-dependent fashion, which was correlated with a reduction of NIS expression at the plasma membrane. Perchlorate, a competitive inhibitor of NIS, prevented these effects, indicating that an increase in intracellular I(-) regulates NIS. Iodide induced rapid intracellular recruitment of plasma membrane NIS molecules and NIS protein degradation. Lower NIS mRNA levels were detected in response to I(-) treatment, although no transcriptional effect was observed. Interestingly, I(-) decreased NIS mRNA stability, affecting NIS translation. Heterologous green fluorescent protein-based reporter constructs revealed a significant repressive effect of the I(-)-targeting NIS mRNA 3 untranslated region. In conclusion, excess I(-) downregulates NIS expression in enterocytes by virtue of a complex mechanism. Our data suggest that I(-) regulates intestinal NIS mRNA expression at the post-transcriptional level as part of an autoregulatory effect of I(-) on its own metabolism.


Figures

Figure 1
Figure 1. Iodide decreases Na+/I symporter (NIS)-mediated I uptake
A, steady-state I uptake in IEC-6 cells incubated with 100 μm I for 3–48 h. Uptake was expressed as picomoles of I per microgram of DNA. Each value represents the mean ± SD of five independent experiments done in triplicate. *P < 0.05, **P < 0.005 vs. control (time 0 h; ANOVA and Newman–Keuls test). B, steady-state I uptake in IEC-6 cells treated with 1–1000 μm I for 24 h. The results are expressed as a percentage of non-I-treated uptake levels for each I concentration. Each value represents the mean ± SD of three independent experiments done in triplicate. *P < 0.05, **P < 0.01 vs. control (time 0 h; ANOVA and Newman–Keuls test). C, steady-state I uptake levels in IEC-18 cells incubated with 100 μm I for 24 h. Each value represents the mean ± SD of two independent experiments performed in triplicate. *P < 0.005 vs. control (ANOVA and Newman–Keuls test). D, I efflux in IEC-6 cells treated with 100 μm I for 24 h. Results are plotted as a percentage of the remaining intracellular I. Decay constants (k) for control and I-treated cells are indicated. E, initial rates (2 min time points) of I uptake at different I concentrations (ranging from 0 to 160 μm) in the presence of a constant Na+ concentration (140 mm). Data were analysed using the following equation: v= (Vmax*[I])/(Km+[I]) and fitted by non-linear least squares using Gnuplot software. Kinetic parameters were determined in triplicate and expressed as means ± SD. *P < 0.05 vs. control Vmax (Student's unpaired t test). F, IEC-6 cells were incubated in buffered Hanks’ balanced salt solution containing 100 μm I in the presence or absence of 1 mm ClO4 for 6 h, where osmolarity was maintained by either Na+ or choline+. After treatment, cells were extensively washed to remove remaining free I, and steady-state I transport was assessed. Each value represents the mean ± SD of three independent experiments done in triplicate. *P < 0.01 vs. 100 μm I (140 mm choline+; ANOVA and Newman–Keuls test).
Figure 2
Figure 2. Iodide treatment decreases NIS plasma membrane expression
A, IEC-6 cells were treated with 100 μm I for different periods of time (0–48 h). Top panel, Western blot analysis of cell surface biotinylated proteins, showing NIS expression at the plasma membrane. Middle panel, immunoblot analysis of whole cell protein extract assayed for NIS expression. Bottom panel, Western blot assay of NIS levels in the intracellular fraction. Blots are representative of five independent experiments. Densitometric analysis was performed to determine relative NIS expression normalized to the loading control E-cadherin or α-tubulin, and indicated as fold change (FC) over NIS protein level in untreated cells, considered as 1.0. B, top panel, representative immunofluorescence staining of IEC-6 cells treated with 100 μm I for the indicated periods of time. Merged images of NIS expression (green) and Na+–K+-ATPase (red), a well-characterized plasma membrane marker, are shown. Scale bars = 50μm. Bottom panel, Manders’ coefficient of co-localization of NIS and the Na+–K+-ATPase was determined for 10 randomly selected images per condition. *P < 0.05 vs. untreated cells (time 0 h; ANOVA and Newman–Keuls test). C, steady-state I uptake in IEC-6 cells incubated with 1 mm I for 6 h in the presence or absence of the endocytosis inhibitors chlorpromazine (CPZ), nystatin (Nys) or amiloride (AML). Uptake levels are expressed as picomoles of I per microgram of DNA. Each value represents the mean ± SD of three independent experiments done in triplicate. *P < 0.05 vs. same condition in the absence of inhibitor; #P < 0.05 vs. control (ANOVA and Newman–Keuls test).
Figure 3
Figure 3. Iodide treatment increases NIS protein turnover through the lysosomal pathway
A, IEC-6 cells were cultured in the presence of 100 μm I for 24 h; thereafter, 3 μm cycloheximide (CHX) was added to the culture media, and total cell lysates were obtained at the indicated times. Top panel, representative Western blot analysis showing NIS expression after blocking protein synthesis. Bottom panel, values from the densitometric analysis were used to calculate the NIS protein half-life (t1/2). Results are expressed as the logarithm of the percentage of remaining NIS expression vs. time; NIS expression before CHX addition (t= 0) was taken as 100%. Ponceau S staining was used to correct loading differences (not shown). Each value represents the mean ± SEM of three independent experiments. *P < 0.05 vs. control t1/2 (Student's unpaired t test). B, representative Western blot of cell extracts. IEC-6 cells were treated with 5 μm MG132 (proteasome inhibitor) or 50 μm chloroquine (CQ; lysosomal inhibitor) in the presence of 100 μm I for 24 h. Inhibitors were added to cell cultures 30 min before I. C, steady-state I uptake in IEC-6 cells treated with 5 μm MG132 for the indicated periods of time. Iodide uptake is expressed as picomoles of I per microgram of DNA. Each value represents the mean ± SD of two independent experiments done in triplicate. *P < 0.05 vs. untreated cells (time 0 h; ANOVA and Newman–Keuls test).
Figure 4
Figure 4. Iodide decreases NIS mRNA levels in enterocytes
A, IEC-6 cell cultures were incubated with 100 μm I for different periods of time. Quantitative PCR analysis was performed to quantify NIS and alkaline phosphatase (ALP) mRNA levels relative to those of β-actin. The expression level of untreated cells was set to 1. Values are indicated as fold change relative to the mRNA levels of untreated cells. *P < 0.01 vs. control (t= 0; ANOVA and Newman–Keuls test). B, male Sprague–Dawley rats (n= 6 per group) were treated with 0.05% I in drinking water for the indicated periods of time. After treatment, villus tip small intestinal absorptive cells were isolated and qPCR analysis was performed to quantify mRNA levels relative to those of the loading control, β-actin. Data are indicated as the fold change relative to the mRNA levels of control animals (set as 1.0) and presented as box plots. *P < 0.05 vs. control (t= 0) (Kruskal–Wallis and Dunn's tests). C, male C57BL/6 mice (n= 5 per group) were subjected to an I-deficient diet for 1–4 weeks. Quantitative mRNA analysis was performed as in B. *P < 0.05 vs. control (t= 0; Kruskal–Wallis and Dunn's tests).
Figure 5
Figure 5. Iodide regulates NIS mRNA levels at a post-transcriptional level
A, IEC-6 cells were transiently transfected with the empty vector pGL3 or the promoter construct pNIS-2.8 linked to the luciferase. Results are expressed as the fold change in luciferase activity, considering pGL3 levels as 1.0. β-Galactosidase activity was used to normalize transfection efficiency. Values are the means ± SD from triplicate samples of three independent experiments. *P < 0.001 vs. untreated pGL3-transfected cells (ANOVA and Newman–Keuls test). B, I-treated IEC-6 cells were incubated with 5 μg ml−1 actinomycin D (ActD) for the indicated time periods. Total RNA was extracted and subjected to reverse transcription. Relative mRNA expression of NIS (top panel) and ALP (bottom panel) was analysed by RT-qPCR. 18S rRNA expression was used as a normalization control. Results are expressed as the logarithm of the percentage of remaining NIS mRNA expression vs. time; NIS expression before addition of ActD (t= 0) was defined as 1.0. Plotted values are the means ± SEM from three independent experiments. *P < 0.05 vs. control t1/2 (Student's unpaired t test).
Figure 6
Figure 6. Iodide-induced NIS repression targets NIS mRNA 3′ untranslated region (3′-UTR)
IEC-6 cells were transiently transfected with the heterologous GFP-based reporter pEGFP 3′-UTR, where NIS mRNA 3′-UTR sequence regulates GFP expression, or pEGFP empty vector as control. After transfection, cells were treated with 100 μm I for 24 h. A, quantification of GFP mRNA levels relative to those of the pEGFP-encoded gene, neomycin resistance gene. The expression level of untreated cells was arbitrarily set to 1. Values representing the mean ± SD of three independent experiments are indicated as fold change relative to the mRNA levels of untreated cells. *P < 0.01 vs. untreated cells (Student's unpaired t test). B, representative Western blot analysis of whole cell extracts assayed for GFP expression. The housekeeping gene α-tubulin was used as loading control. β-Galactosidase activity was measured in order to evaluate equal transfection efficiency. Densitometric analysis was performed to determine the relative protein expression of GFP normalized to α-tubulin levels, and corrected by transfection efficiency. The relative protein expression of GFP in untreated IEC-6 cells was set arbitrarily to 1.0. The results represent the means of three independent experiments. *P < 0.05 vs. untreated cells (Student's unpaired t test).

Similar articles

Cited by

References

    1. Altorjay A, Dohán O, Szilágyi A, Paroder M, Wapnir IL, Carrasco N. Expression of the Na+/I− symporter (NIS) is markedly decreased or absent in gastric cancer and intestinal metaplastic mucosa of Barrett esophagus. BMC Cancer. 2007;7:5. - PMC - PubMed
    1. Bermano G, Arthur JR, Hesketh JE. Role of the 3′ untranslated region in the regulation of cytosolic glutathione peroxidase and phospholipid-hydroperoxide glutathione peroxidase gene expression by selenium supply. Biochem J. 1996;320:891–895. - PMC - PubMed
    1. Beyer S, Lakshmanan A, Liu YY, Zhang X, Wapnir I, Smolenski A, Jhiang S. KT5823 differentially modulates sodium iodide symporter expression, activity, and glycosylation between thyroid and breast cancer cells. Endocrinology. 2011;152:782–792. - PMC - PubMed
    1. Bizhanova A, Kopp P. Minireview: The sodium-iodide symporter NIS and pendrin in iodide homeostasis of the thyroid. Endocrinology. 2009;150:1084–1090. - PMC - PubMed
    1. Braverman LE, Ingbar SH. Changes in thyroidal function during adaptation to large doses of iodide. J Clin Invest. 1963;42:1216–1231. - PMC - PubMed

Publication types

LinkOut - more resources