. 2013 Jan 1;64(6):526-37.
doi: 10.1016/j.neuroimage.2012.09.043. Epub 2012 Sep 21.

Removing motion and physiological artifacts from intrinsic BOLD fluctuations using short echo data

Affiliations

Removing motion and physiological artifacts from intrinsic BOLD fluctuations using short echo data

Molly G Bright et al. Neuroimage. .

Abstract

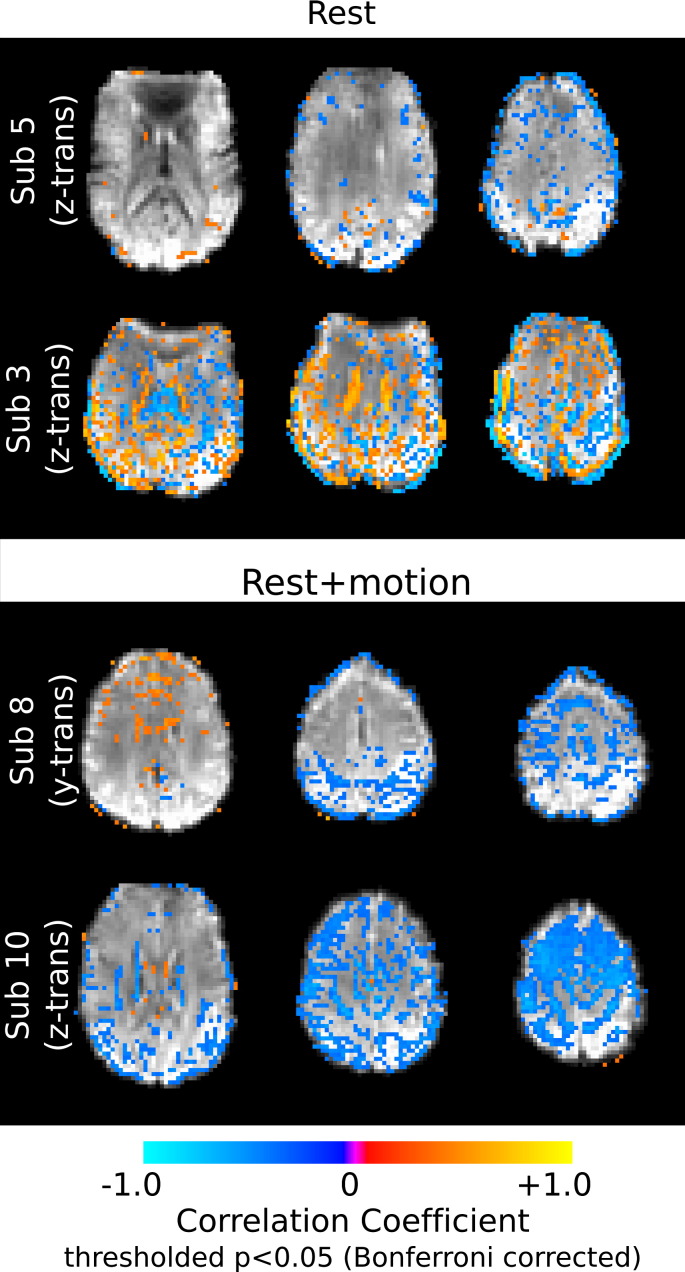
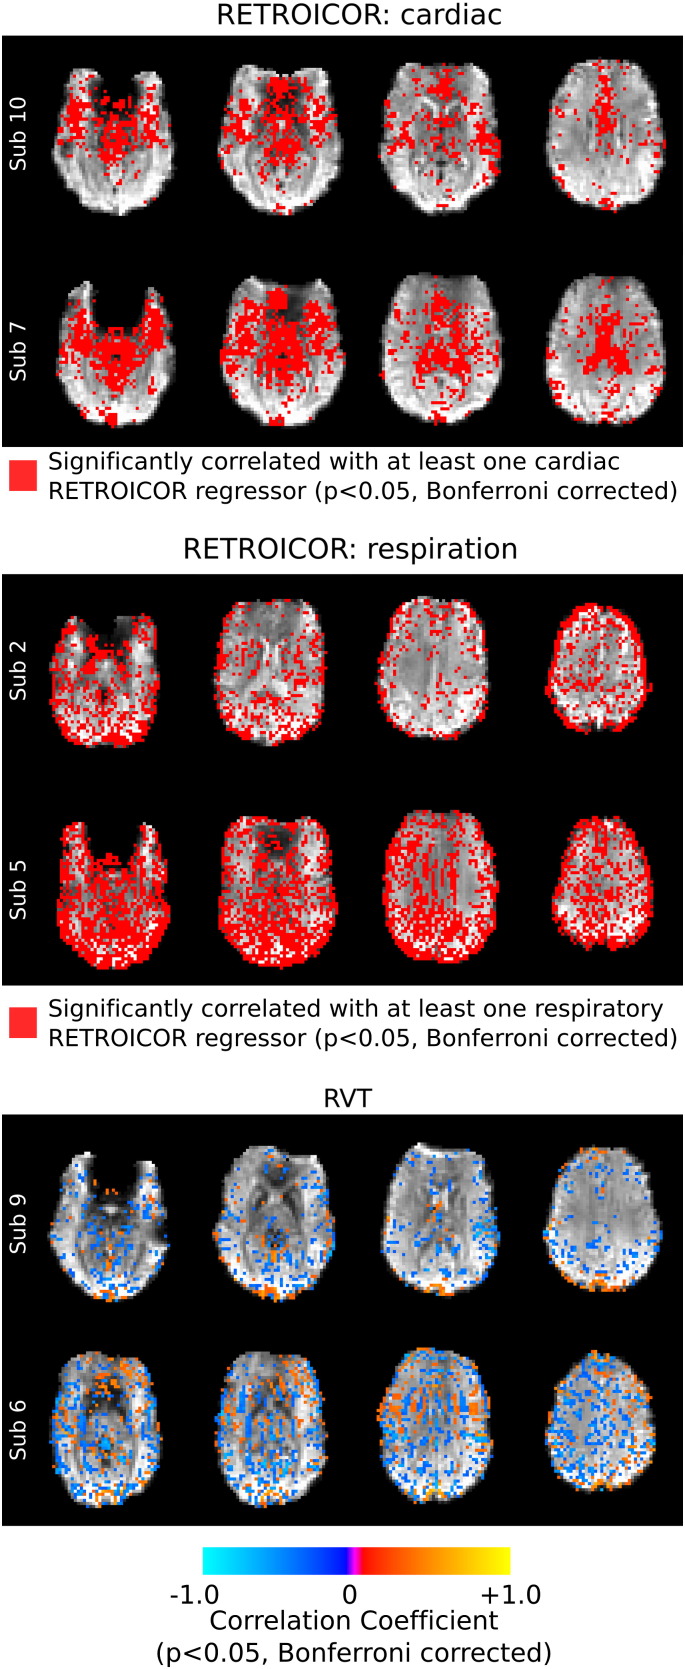
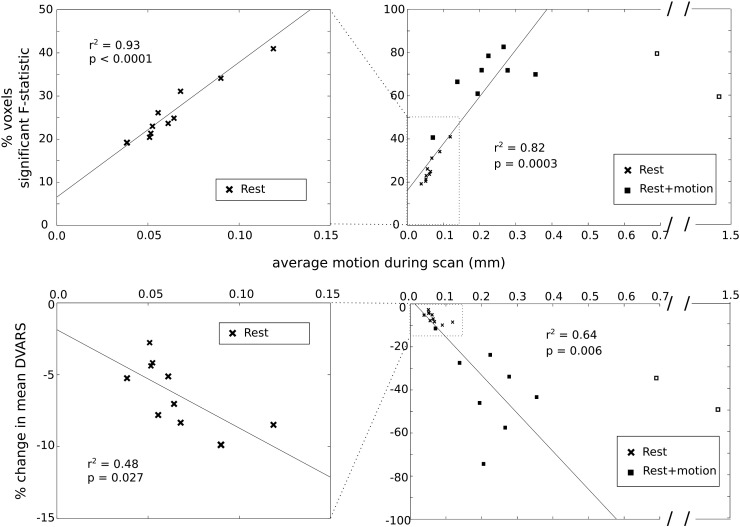
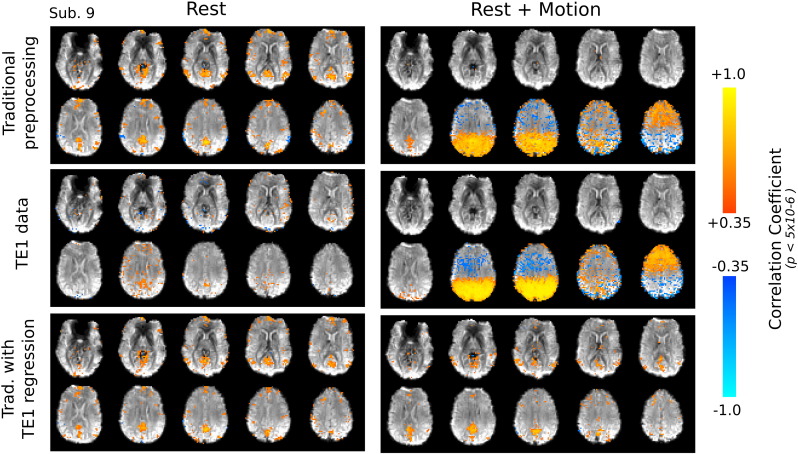
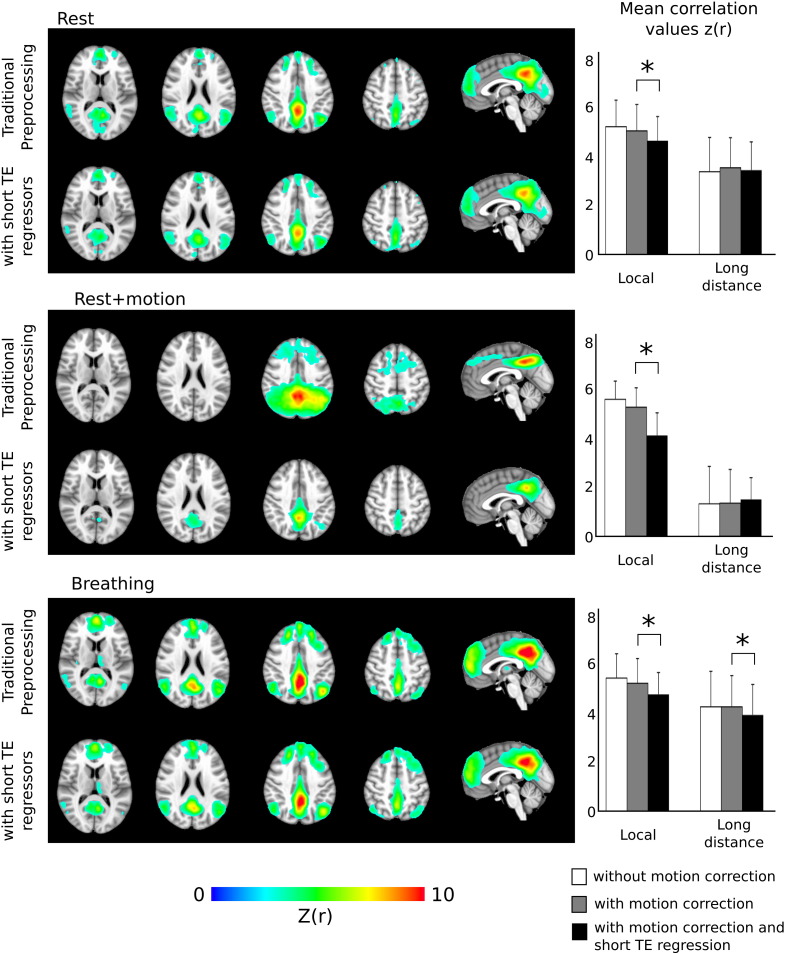
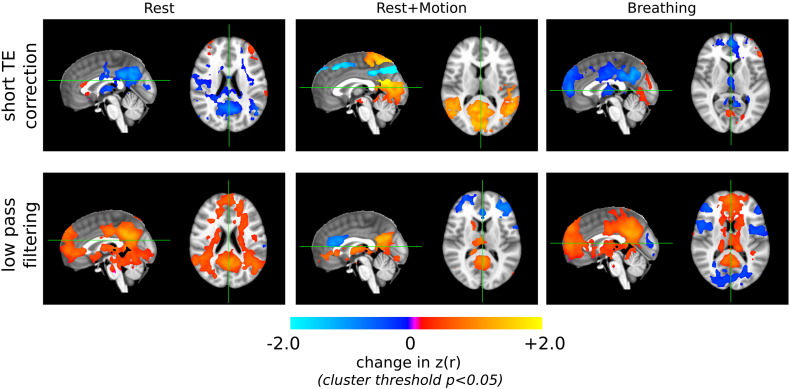
Differing noise variance across study populations has been shown to cause artifactual group differences in functional connectivity measures. In this study, we investigate the use of short echo time functional MRI data to correct for these noise sources in blood oxygenation level dependent (BOLD)-weighted time series. A dual-echo sequence was used to simultaneously acquire data at both a short (TE=3.3 ms) and a BOLD-weighted (TE=35 ms) echo time. This approach is effectively "free," using dead-time in the pulse sequence to collect an additional echo without affecting overall scan time or temporal resolution. The proposed correction method uses voxelwise regression of the short TE data from the BOLD-weighted data to remove noise variance. In addition to a typical resting state scan, non-compliant behavior associated with patient groups was simulated via increased head motion or physiological fluctuations in 10 subjects. Short TE data showed significant correlations with the traditional motion-related and physiological noise regressors used in current connectivity analyses. Following traditional preprocessing, the extent of significant additional variance explained by the short TE data regressors was significantly correlated with the average head motion across the scan in the resting data (r(2)=0.93, p<0.0001). The reduction in data variance following the inclusion of short TE regressors was also correlated with scan head motion (r(2)=0.48, p=0.027). Task-related data were used to demonstrate the effects of the short TE correction on BOLD activation time series with known temporal structure; the size and strength of the activation were significantly decreased, but it is not clear whether this reflects BOLD contamination in the short TE data or correlated changes in blood volume. Finally, functional connectivity maps of the default mode network were constructed using a seed correlation approach. The effects of short TE correction and low-pass filtering on the resulting correlations maps were compared. Results suggest that short TE correction more accurately differentiates artifactual correlations from the correlations of interest in conditions of amplified noise.


Figures

Fig. 1
Fig. 1
Significant correlation of short TE data (TE = 3.3 ms) and selected motion regressors (thresholded at p < 0.05, Bonferroni corrected). Correlation maps are presented for subjects exhibiting the median (top rows) and maximum (bottom rows) total scan motion in the Rest and Rest + Motion data sets (maps illustrate significant correlations with the motion regressor exhibiting the greatest number of correlated voxels in that subject's data (as determined using the results provided in the supplementary material). Not shown are the correlation maps of subjects exhibiting the minimum number of correlated voxels, as there were subjects with zero significant correlations with at least one motion regressor in both data sets.
Fig. 2
Fig. 2
Significant correlation of short TE data (TE = 3.3 ms) and physiological regressors (p < 0.05, Bonferroni corrected). Binary maps of voxels where the short TE time series were significantly correlated (or anticorrelated) with any of the four cardiac or four respiratory RETROICOR regressors are shown, as well as thresholded correlation maps of the short TE data and the RVT regressor. The subjects presented exhibited the median (top rows) and maximum (bottom rows) numbers of significantly correlated voxels, as discussed in the supplementary material.
Fig. 3
Fig. 3
Top row: the percentage of brain voxels where short TE data regressors explain significant additional variance is strongly correlated with the average head motion across the scan (r2 = 0.93, p < 0.0001) in the Rest data set. This correlation continues when the head motion is amplified (combined Rest and Rest + Motion data, r2 = 0.82, p = 0.0003). Note that the Rest + Motion data of two subjects were identified as outliers, with average scan head motion more than three standard deviations from the combined group mean, and excluded from the correlation analysis. These datapoints are identified as open squares. Bottom row: the percentage reduction in data variance (average scan DVARS) following short TE data correction is strongly correlated with the average head motion across the scan in the Rest (r2 = 0.48, p = 0.027) and in the combined Rest and Rest + Motion data, excluding the same two outliers as above (r2 = 0.64, p = 0.006).
Fig. 4
Fig. 4
Unsmoothed seed correlation maps of one subject (thresholded at p < 5 × 10− 6). The Rest data exhibit the expected default mode network following traditional preprocessing, and the additional regression of TE1 data maintains the qualitative network pattern. In the Rest + Motion data of this subject, traditional preprocessing of the BOLD-weighted TE2 data does not resolve the default mode network; instead, the correlation map is dominated by gross head motion artifacts. These artifacts are also present in the TE1 Rest + Motion data set, and the TE1 regression method better resolves the expected network map in the TE2 data.
Fig. 5
Fig. 5
Group average seed correlation maps of the default mode network of 10 subjects (cluster threshold p < 0.005) in the Rest, Rest + Motion, and Breathing data sets following traditional preprocessing and with the addition of short TE data regressors. The mean z(r) statistics within local and long-distance ROIs were calculated in each data set of each subject, and the group averages are presented graphically. The local correlation values were significantly reduced in all data sets (paired t-test, p < 0.05 corrected for multiple comparisons) and the long-distance correlation values were significantly reduced in the Breathing data only.
Fig. 6
Fig. 6
Significant changes in correlation values following short TE correction or following low-pass (< 0.1 Hz) filtering (corrected cluster threshold p < 0.05). The short TE correction significantly reduced DMN correlation values in the Rest data, in agreement with Fig. 5, whereas low-pass filtering increased correlation values. In the Rest + Motion data, short TE correction resulted in greater enhancement of DMN correlation values than low-pass filtering, simultaneously reducing other correlations associated with large head motion. In the Breathing data, low-pass filtering increased artifactual correlations near ventricles, likely related to uncorrected physiological noise, whereas short TE correction reduced these effects.

References

    1. Bandettini P.A., Wong E.C., Hinks R.S., Tikofsky R.S., Hyde J.S. Time course EPI of human brain function during task activation. Magn. Reson. Med. 1992;25(2):390–397. - PubMed
    1. Barth M., Metzler A., Klarhoefer M., Roell S., Moser E., Leibfritz D. Functional MRI of the human motor cortex using single-shot, multiple gradient-echo spiral imaging. Magn. Reson. Imaging. 1999;17(9):1239–1243. - PubMed
    1. Beckmann C.F., Smith S.M. Probabilistic independent component analysis for functional magnetic resonance imaging. IEEE Trans. Med. Imaging. 2004;23(2):137–152. - PubMed
    1. Bianciardi M., Fukunaga M., van Gelderen P., de Zwart J.A., Duyn J.H. Negative BOLD-fMRI signals in large cerebral veins. J. Cereb. Blood Flow Metab. 2011;31:401–412. - PMC - PubMed
    1. Birn R.M. The role of physiological noise in resting-state functional connectivity. Neuroimage. 2012;62(2):864–870. - PubMed

Publication types