Comparative Study
. 2012 Sep 24:13:505.
doi: 10.1186/1471-2164-13-505.

Comparative exome sequencing of metastatic lesions provides insights into the mutational progression of melanoma

Affiliations
Comparative Study

Comparative exome sequencing of metastatic lesions provides insights into the mutational progression of melanoma

Jared J Gartner et al. BMC Genomics. .

Abstract

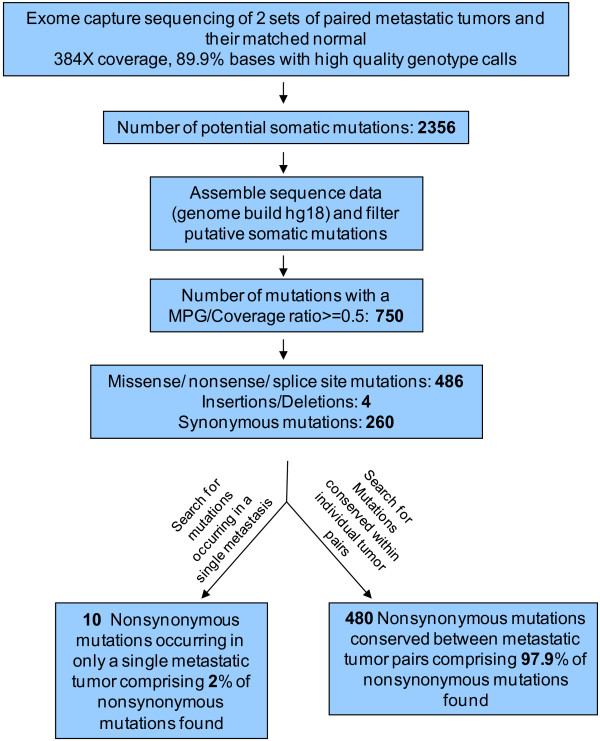
Background: Metastasis is characterized by spreading of neoplastic cells to an organ other than where they originated and is the predominant cause of death among cancer patients. This holds true for melanoma, whose incidence is increasing more rapidly than any other cancer and once disseminated has few therapeutic options. Here we performed whole exome sequencing of two sets of matched normal and metastatic tumor DNAs.

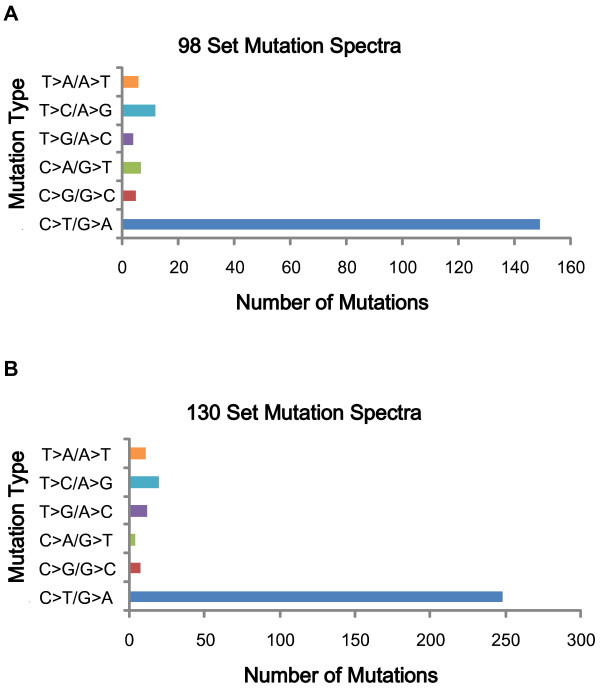
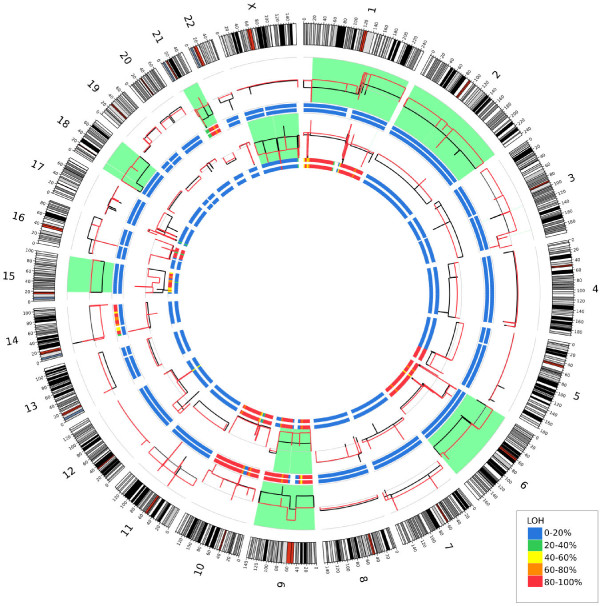
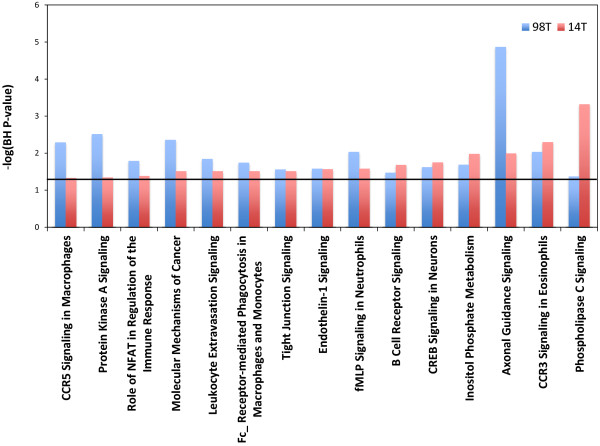
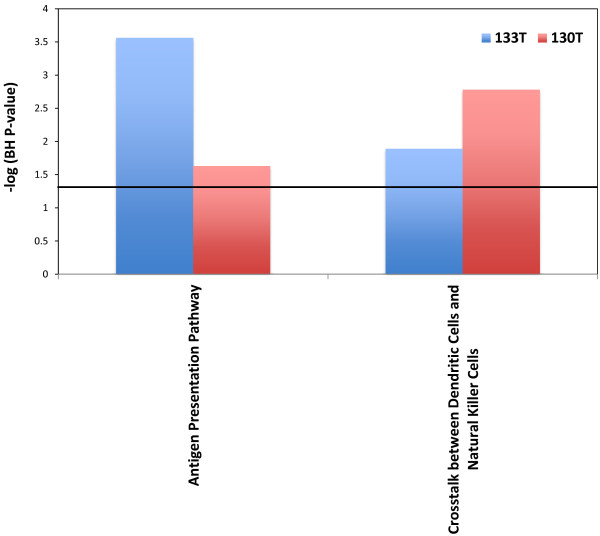
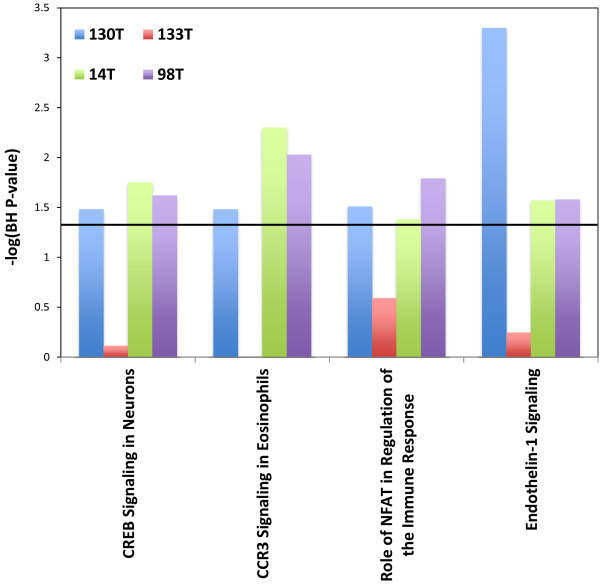
Results: Using stringent criteria, we evaluated the similarities and differences between the lesions. We find that in both cases, 96% of the single nucleotide variants are shared between the two metastases indicating that clonal populations gave rise to the distant metastases. Analysis of copy number variation patterns of both metastatic sets revealed a trend similar to that seen with our single nucleotide variants. Analysis of pathway enrichment on tumor sets shows commonly mutated pathways enriched between individual sets of metastases and all metastases combined.

Conclusions: These data provide a proof-of-concept suggesting that individual metastases may have sufficient similarity for successful targeting of driver mutations.


Figures

Figure 1
Figure 1
Whole exome capture and sequencing analysis of melanoma samples derived from two sets of paired metastatic tumors. Schematic overview of mutation identification approach of the four whole exomes. Samples were obtained at The Surgery Branch, National Cancer Institute.
Figure 2
Figure 2
Mutation spectra of single base pair substitutions in melanoma whole exome sequencing. The number of each of the six classes of base substitutions resulting in non-synonymous changes in the whole exome screen is shown. A.) Mutation spectra from 98 set; B.) Mutation spectra from 130 set.
Figure 3
Figure 3
Circos plot depicting copy number in the genome. Outer ideogram runs clockwise from chromosome 1 to chromosome X with labels in Mb of physical distance. The data are represented in several tracks. The innermost track is a heat map representing the proportion of variants showing LOH in 5 MB bins for the 130 metastatic sample. The next innermost track shows the LOH results for the 133 metastatic sample. The data tracks depict relative copy number for the 130 met sample (in red) and the 133 met sample (in black). Regions that show large copy number differences between the two metastatic samples are highlighted in light green. Proceeding outward are two more heatmap LOH tracks for sample 14 met and then for sample 98 met. Finally, relative copy number profiles for samples 14 (in black) and 98 (in red) are shown; again, light green highlights regions of significant copy number change. For all heatmap tracks, blue represents no LOH in the region while red represents nearly all SNVs in the region showing LOH.
Figure 4
Figure 4
Shared enriched pathways in the 98 set. Y axis represents the –log p-value for enrichment. Black horizontal line represents a –log value of 1.3.
Figure 5
Figure 5
Shared enriched pathways in the 130 set. Y axis represents the –log p-value for enrichment. Black horizontal line represents a –log value of 1.3.
Figure 6
Figure 6
Shared enriched pathways between the two sets. Y axis represents the –log p-value for enrichment. Black horizontal line represents a –log value of 1.3.

References

    1. Jemal A, Siegel R, Xu J, Ward E. Cancer statistics, 2010. CA Cancer J Clin. 2010;60(5):277–300. doi: 10.3322/caac.20073. - DOI - PubMed
    1. SEER Cancer Statistics Review, 1975–2008. http://seer.cancer.gov/csr/1975_2008/
    1. Flaherty KT, Puzanov I, Kim KB, Ribas A, McArthur GA, Sosman JA, O'Dwyer PJ, Lee RJ, Grippo JF, Nolop K. et al.Inhibition of mutated, activated BRAF in metastatic melanoma. N Engl J Med. 2010;363(9):809–819. doi: 10.1056/NEJMoa1002011. - DOI - PMC - PubMed
    1. Gnirke A, Melnikov A, Maguire J, Rogov P, LeProust EM, Brockman W, Fennell T, Giannoukos G, Fisher S, Russ C. et al.Solution hybrid selection with ultra-long oligonucleotides for massively parallel targeted sequencing. Nat Biotechnol. 2009;27(2):182–189. doi: 10.1038/nbt.1523. - DOI - PMC - PubMed
    1. Wei X, Walia V, Lin JC, Teer JK, Prickett TD, Gartner J, Davis S, Stemke-Hale K, Davies MA, Gershenwald JE. et al.Exome sequencing identifies GRIN2A as frequently mutated in melanoma. Nat Genet. 2011;43(5):442–446. doi: 10.1038/ng.810. - DOI - PMC - PubMed

Publication types