. 2012 Sep 24:12:218.
doi: 10.1186/1471-2180-12-218.

Factors regulated by interferon gamma and hypoxia-inducible factor 1A contribute to responses that protect mice from Coccidioides immitis infection

Affiliations

Factors regulated by interferon gamma and hypoxia-inducible factor 1A contribute to responses that protect mice from Coccidioides immitis infection

Christopher H Woelk et al. BMC Microbiol. .

Abstract

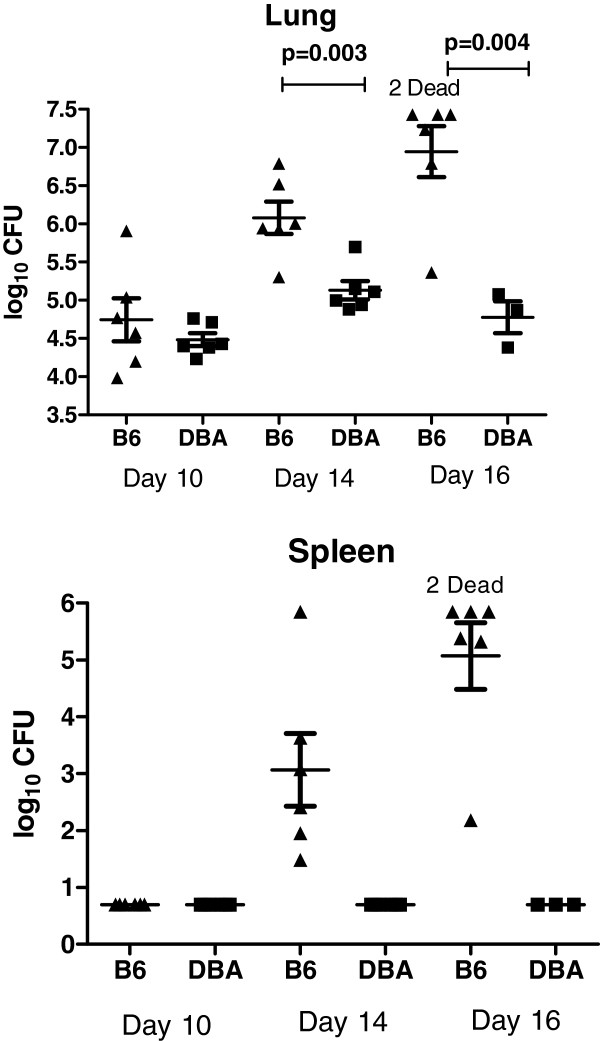
Background: Coccidioidomycosis results from airborne infections caused by either Coccidioides immitis or C. posadasii. Both are pathogenic fungi that live in desert soil in the New World and can infect normal hosts, but most infections are self-limited. Disseminated infections occur in approximately 5% of cases and may prove fatal. Mouse models of the disease have identified strains that are resistant (e.g. DBA/2) or susceptible (e.g. C57BL/6) to these pathogens. However, the genetic and immunological basis for this difference has not been fully characterized.

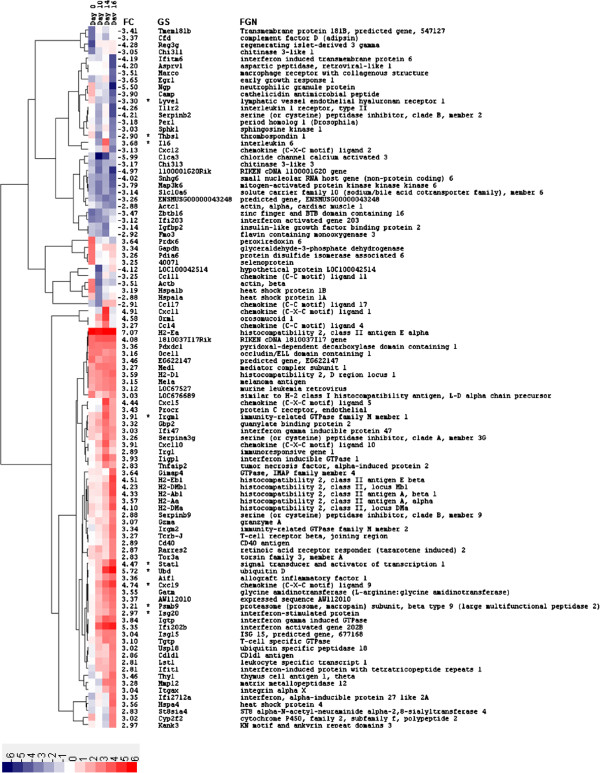
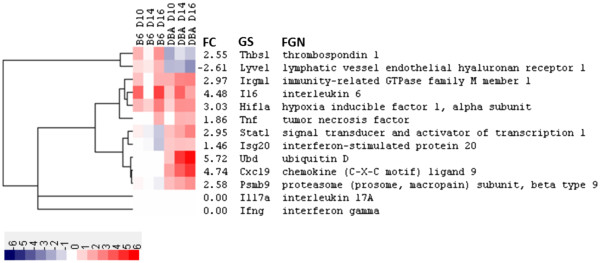
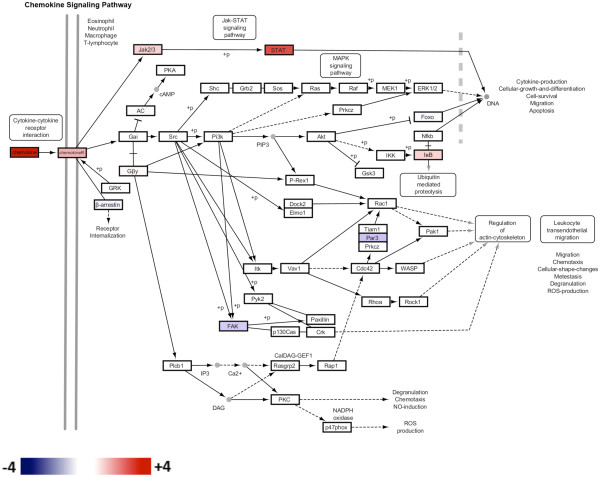
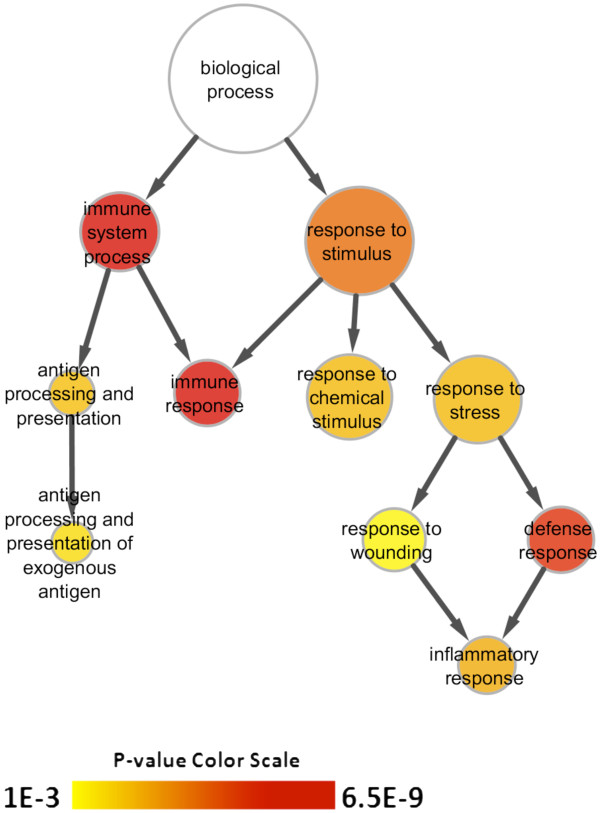
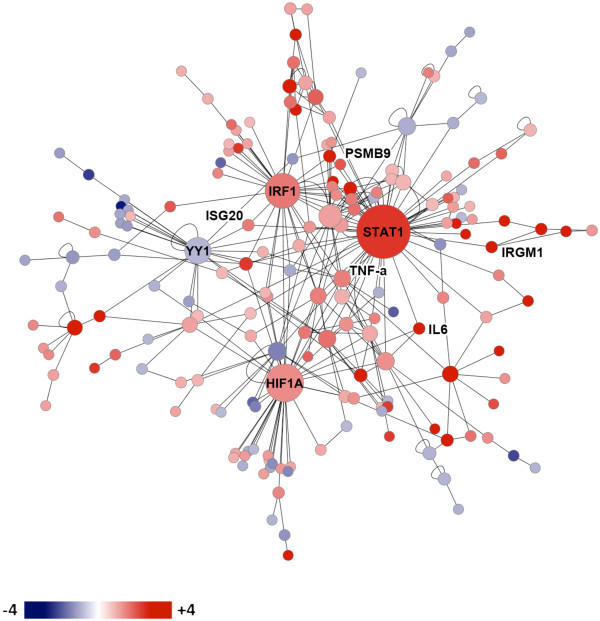
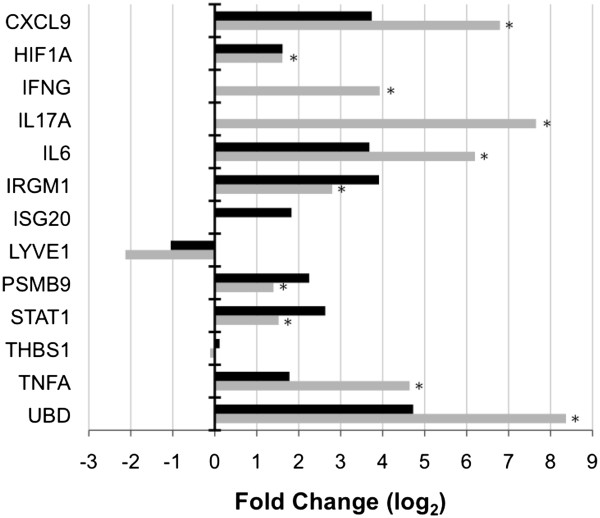
Results: Microarray technology was used to identify genes that were differentially expressed in lung tissue between resistant DBA/2 and sensitive C57BL/6 mice after infection with C. immitis. Differentially expressed genes were mapped onto biological pathways, gene ontologies, and protein interaction networks, which revealed that innate immune responses mediated by Type II interferon (i.e., IFNG) and the signal transducer and activator of transcription 1 (STAT1) contribute to the resistant phenotype. In addition, upregulation of hypoxia inducible factor 1A (HIF1A), possibly as part of a larger inflammatory response mediated by tumor necrosis factor alpha (TNFA), may also contribute to resistance. Microarray gene expression was confirmed by real-time quantitative PCR for a subset of 12 genes, which revealed that IFNG HIF1A and TNFA, among others, were significantly differentially expressed between the two strains at day 14 post-infection.

Conclusion: These results confirm the finding that DBA/2 mice express more Type II interferon and interferon stimulated genes than genetically susceptible strains and suggest that differential expression of HIF1A may also play a role in protection.


Figures

Figure 1
Figure 1
Comparison of C. immitis infection between resistant DBA/2 and sensitive C57BL/6 mice. Mice were infected (i.n.) and then sacrificed at the indicated intervals. The right lung and spleen of each mouse was homogenized and cultured quantitatively. Each symbol represents an individual mouse and the horizontal lines are the geometric mean ± standard error of the mean. The infection proceeded more rapidly in the lungs of the C57BL/6 mice and dissemination to the spleen occurred only in this strain, another indication of their increased susceptibility to infection. P-values comparing lung CFU were calculated with an unpaired Student’s t-test using GraphPad Prism (San Diego, CA). There was no significant difference between CFU in the lungs of the two strains on day 10 after infection.
Figure 2
Figure 2
A heatmap depicting the top 100 modulated genes that were differentially expressed between DBA/2 and C57BL/6 mice. Fold changes were calculated between mice strains prior to (day 0) and following infection (days 10, 14, and 16) with C. immitis. For each gene, the absolute peak log2 fold change (FC) was identified across time points and the top 100 included in the heatmap. The log2 fold change scale is indicated at the bottom of the heatmap, where red shading indicates greater expression in DBA/2 compared to C57BL/6 mice and blue shading represents lesser expression. For example, red shading will result if a gene is expressed to a greater extent in DBA/2 compared to C57BL/6 mice or if a constitutively expressed gene is downregulated in DBA/2 to a lesser extent compared to C57BL/6. Therefore, the direction of gene expression changes for each of the top 100 modulated genes is presented in Additional file 1: Figure S1 by dividing expression levels at post-infection time points (day 10, 14, and 16) by those in the uninfected control (day 0). Hierarchical clustering of genes based on their expression profiles over the time course is reflected in the dendogram to the right of the heatmap and was performed by calculating distances using the Pearson correlation metric and then clustering distances using the average linkage method. The expression of genes marked with an asterisk (*) was confirmed by RT-qPCR. Annotation columns are as follows: FC, peak log2 fold change; GS, gene symbol; FGN, full gene name.
Figure 3
Figure 3
A heatmap of fold changes calculated by comparing gene expression at post-infection time points to day 0 (pre-infection) for the 13 targets selected for RT-qPCR analysis. Calculating fold changes in this way provides confirmation of the direction (up or down) of expression changes. Fold change is presented on a log2 scale as indicated at the bottom of the heatmap, where red shading indicates upregulation and blue shading represents downregulation of gene expression. The genes were clustered based on their expression profiles as described in the legend for Figure 2. The abbreviations for the annotation columns are defined as for Figure 2.
Figure 4
Figure 4
Chemokine Signaling Pathway from the KEGG database (ID: mmu04062) overlaid with log2 fold change values for genes differentially expressed between DBA/2 and C57BL/6 at day 14. The scale for log2 fold change values is indicated at the bottom of the pathway diagram, where red shading indicates greater expression in DBA/2 compared to C57BL/6 mice and blue shading represents lesser expression. Genes not differentially expressed, i.e., with a fold change between −2 and +2 (log2 fold change between −1 and +1) are depicted in white.
Figure 5
Figure 5
Hierarchical depiction of GO terms significantly over-represented in the set of genes that were differentially expressed with a fold change ≥ 2 or ≤ -2 (log2 fold change ≥ 1 or ≤ -1, respectively) between DBA/2 and C57BL/6 mice at any time point (N = 1334). The size of the node associated with each GO term is relative to the number of differentially expressed genes belonging to that term. The color scale indicates the level of significance associated with each node with red being the most significant. For display purposes only GO terms with an FDR corrected p-value <0.001 are depicted. The full list of significant GO terms using an FDR corrected p-value cut off <0.05 is available in Additional file 2: Table S2.
Figure 6
Figure 6
Direct protein interaction network constructed from the genes differentially expressed with a fold change ≥ 2 or ≤ -2 (log2 fold change ≥ 1 or ≤ -1, respectively) between DBA/2 and C57BL/6 mice at day 14 following C. immitis infection (N = 416). MetaCore was used to identify protein-protein and protein-DNA interactions between the protein products of differentially expressed genes and Cytoscape was used to visualize the network. Log2 fold changes were superimposed on this protein network such that red indicates greater expression in DBA/2 versus C57BL/6 mice, and blue lesser expression, as indicated by the scale bar. Each node represents a gene and the size of a node is indicative of the number of interactions the product of each gene makes at the protein level. The largest nodes are labeled HIF1A, IRF1, STAT1 and YY1, and represent hubs that correspond to transcription factors.
Figure 7
Figure 7
Confirmation of gene expression differences by RT-qPCR between DBA/2 and C57BL/6 mice at day 14 following C. immitis infection. The fold change for each gene, calculated by dividing the expression level in DBA/2 mice by the expression level in C57BL/6 mice is presented for RT-qPCR data (grey bars). These fold change differences are also compared to microarray results (black bars) for each gene. For the RT-qPCR data, gene expression was assessed using 2 independent samples from C57BL/6 mice and 3 independent samples from DBA/2 mice. RT-qPCR gene expression data (2-∆∆CT) was averaged within mouse strains and then used to calculate log2 fold change values between strains for direct comparison to microarray data. A log2 fold change of 1 equates to an actual fold change of 2. A positive fold change indicates the gene was expressed to a greater extent in DBA/2 mice, and a negative fold change means higher expression in C57BL/6. An asterisk (*) indicates that the gene was significantly differentially expressed (p <0.05, t-test) between mice strains at day 14.

Similar articles

Cited by

References

    1. Fisher MC, Koenig GL, White TJ, Taylor JW. Molecular and phenotypic description of Coccidioides posadasii sp. nov., previously recognized as the non-California population of Coccidioides immitis. Mycologia. 2002;94:73–84. doi: 10.2307/3761847. - DOI - PubMed
    1. Laniado-Laborin R. Expanding understanding of epidemiology of coccidioidomycosis in the Western hemisphere. Ann N Y Acad Sci. 2007;1111:19–34. doi: 10.1196/annals.1406.004. - DOI - PubMed
    1. Kirkland TN, Fierer J. Coccidioidomycosis: a reemerging infectious disease. Emerg Infect Dis. 1996;2:192–199. doi: 10.3201/eid0203.960305. - DOI - PMC - PubMed
    1. Valdivia L, Nix D, Wright M, Lindberg E, Fagan T, Lieberman D, Stoffer T, Ampel NM, Galgiani JN. Coccidioidomycosis as a common cause of community-acquired pneumonia. Emerg Infect Dis. 2006;12:958–962. doi: 10.3201/eid1206.060028. - DOI - PMC - PubMed
    1. Ampel NM, Dols CL, Galgiani JN. Coccidioidomycosis during human immunodeficiency virus infection: results of a prospective study in a coccidioidal endemic area. Am J Med. 1993;94:235–240. doi: 10.1016/0002-9343(93)90054-S. - DOI - PubMed

Publication types

Substances