Review
. 2012 Sep;3(9):954-87.
doi: 10.18632/oncotarget.652.

Mutations and deregulation of Ras/Raf/MEK/ERK and PI3K/PTEN/Akt/mTOR cascades which alter therapy response

Affiliations
Review

Mutations and deregulation of Ras/Raf/MEK/ERK and PI3K/PTEN/Akt/mTOR cascades which alter therapy response

James A McCubrey et al. Oncotarget. 2012 Sep.

Abstract

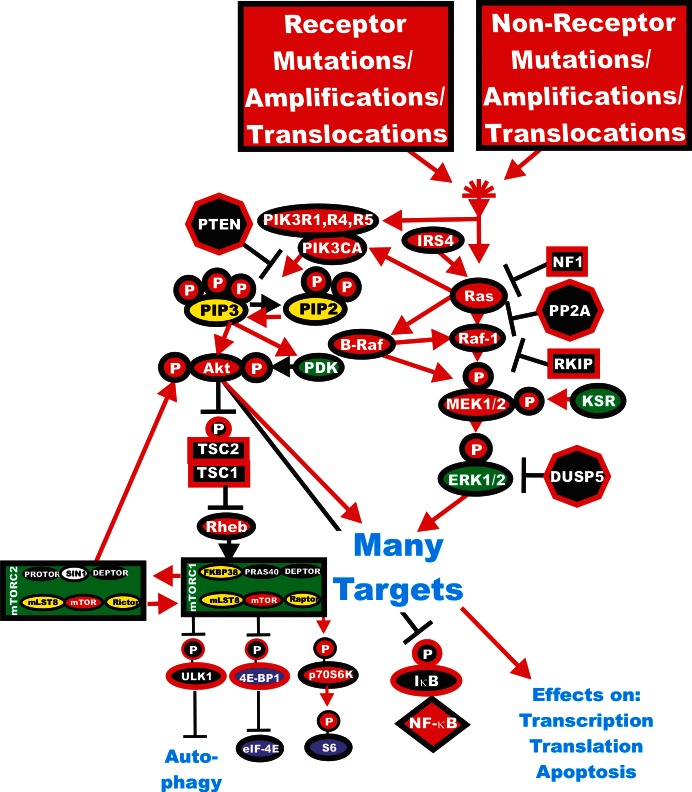
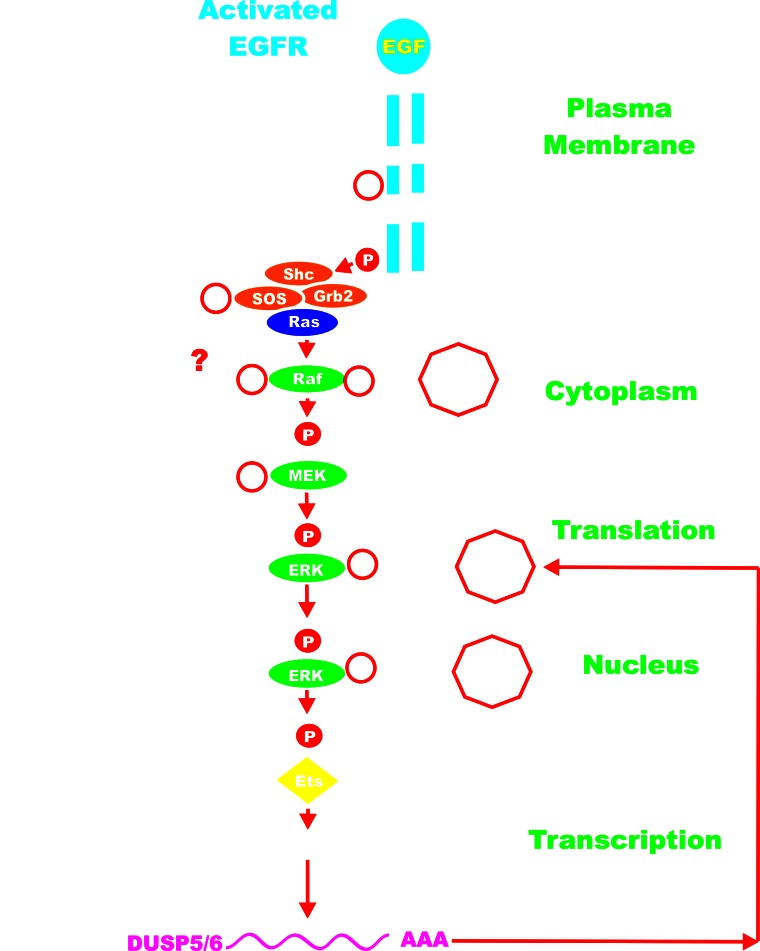
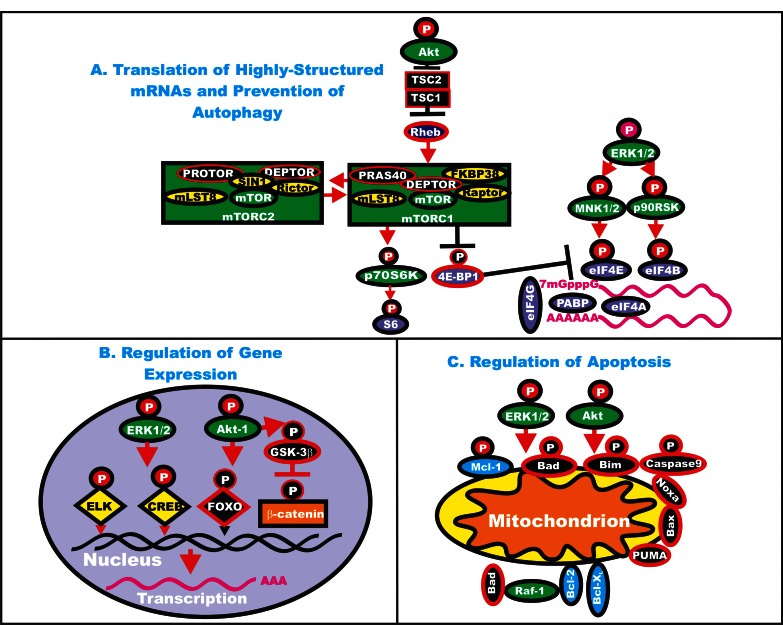
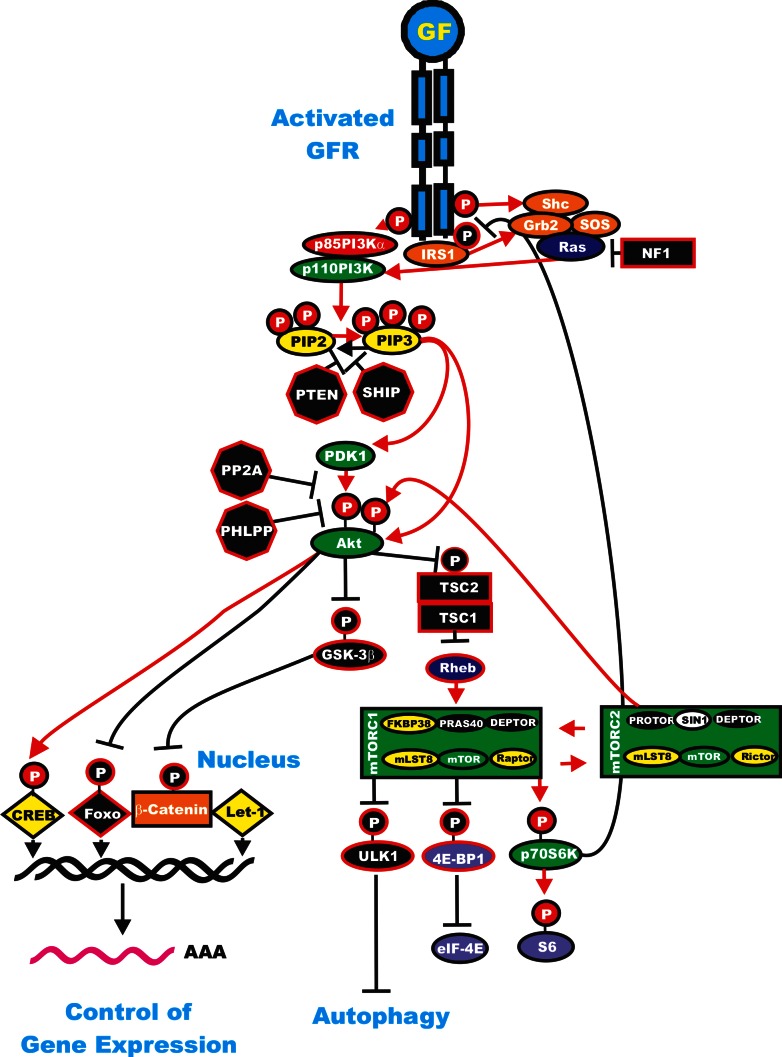
The Ras/Raf/MEK/ERK and PI3K/PTEN/Akt/mTOR cascades are often activated by genetic alterations in upstream signaling molecules such as receptor tyrosine kinases (RTK). Certain components of these pathways, RAS, NF1, BRAF, MEK1, DUSP5, PP2A, PIK3CA, PIK3R1, PIK3R4, PIK3R5, IRS4, AKT, NFKB1, MTOR, PTEN, TSC1, and TSC2 may also be activated/inactivated by mutations or epigenetic silencing. Upstream mutations in one signaling pathway or even in downstream components of the same pathway can alter the sensitivity of the cells to certain small molecule inhibitors. These pathways have profound effects on proliferative, apoptotic and differentiation pathways. Dysregulation of components of these cascades can contribute to: resistance to other pathway inhibitors, chemotherapeutic drug resistance, premature aging as well as other diseases. This review will first describe these pathways and discuss how genetic mutations and epigenetic alterations can result in resistance to various inhibitors.


Figures

Figure 1
Figure 1. Activation of the Ras/Raf/MEK/ERK and Ras/PI3K/PTEN/Akt/mTOR Pathways by Genetic Mutations
Activation of the Ras/Raf/MEK/ERK and Ras/PI3K/PTEN/Akt/mTOR pathways can occur by upstream mutations in growth factor receptors or by mutations in upstream kinases and coupling molecules. In addition, intrinsic members of the two pathways are frequently mutated in human cancer. Genes in the Ras/Raf/MEK/ERK and Ras/PI3K/PTEN/Akt/mTOR pathways that have activating mutations detected in human cancer and proliferative diseases are indicated in red ovals. Four mutations have been detected in the RHEB gene in 903 samples present in the Sanger Institute COSMIC database. Four mutations have been observed in the p70S6K gene (RBS6KB1) out of 1047 samples examined (Sanger Institute COSMIC database. Also loss of tumor suppressor genes such as PTEN, PP2A, NF1 DUSP5, TSC1, TSC2 can contribute to activation of certain pathways. These are indicated in black octagons if they are phosphatases or black squares if they are coupling molecules. Other kinases not frequently mutated in human cancer are indicated in green symbols. PIP2 and PIP3 are indicated in yellow ovals. The 4E-BP1and eIF-4E proteins are indicated in purple ovals. mTORC1 phosphorylates the unc-51-like kinase 1 (ULK1) which results in the suppression of autophagy. ULK1 is indicated in a black oval. The mTORC1 inhibitor prevents phosphorylation of ULK1 and autophagy can occur. Red arrows indicate activating events in pathways. Black arrows indicate inactivating events in pathway. Activating phosphorylation events are depicted in red circles with Ps with a black outlined circle. Inactivating phosphorylation events are depicted in black circles with Ps with a red outlined circle.
Figure 2
Figure 2. Regulatory Loops in the Ras/Raf/MEK/ERK Pathway
ERK can phosphorylate members of the Ras/Raf/MEK/ERK pathway and even upstream EGFR. Sometimes these phosphorylation events mediated by ERK can inhibit the activity of the phosphorylated molecule. ERK can also phosphorylate Ets which can lead to transcription of the DUSP genes which in turn can inactivate ERK by dephosphorylation. PP2A can also suppress Raf activity by dephosphorylation. The activated EGFR is depicted in blue. Kinases are indicated by green ovals. Phosphatases are indicated by black octagons. Coupling molecules are indicated by orange ovals. Ras is indicated by a purple oval. The transcription factors Ets is indicated by a yellow diamond. The activated EGFR is depicted in blue. Red arrows indicate activating events in pathways. Black arrows indicate inactivating events in pathway. Activating phosphorylation events are depicted in red circles with Ps with a black outlined circle. Inactivating phosphorylation/dephosphorylation events are depicted in black circles with Ps with a red outlined circle.
Figure 3
Figure 3. Effects of ERK and Akt on Regulatory Processes
ERK and Akt can phosphorylate many targets which serve to regulate cell proliferation. In Panel A, some of the effects of ERK and Akt on the translation of highly structured mRNAs are indicated. Kinases are indicated in green ovals or rectangles (mTORC1 and mTORC2 complexes). TSC1 and TSC2 are indicated in black squares. Rheb is indicated in a dark blue oval. mTOR interacting proteins which positively regulate mTOR activity are indicated in yellow ovals. mTOR interactiving proteins which negatively regulate mTOR activity are indicated in black ovals. mRNA initiation factors and proteins associated with the ribosome are indicated in purple ovals. In Panel B, some of the effects on the regulation of gene expression by ERK and Akt phosphorylation are indicated. Transcription factors activated by either ERK or Akt phosphorylation are indicated in yellow diamonds. The Foxo transcription factor that is inactivated by Akt phosphorylation is indicated by a black diamond. Beta-catenin is indicated in an orange rectangle. In Panel C, some of the effects of ERK and Akt phosphorylation on apoptotic regulatory molecules are indicated. Molecules such as Mcl-1 which are anti-apoptotic and phosphorylated by ERK and Akt are indicated by blue ovals, other anti-apoptotic molecule are also indicated by blue ovals. Pro-apoptotic molecules are indicated by black ovals. Red arrows indicate activating events in pathways. Black arrows indicate inactivating events in pathway. Activating phosphorylation events are depicted in red circles with Ps with a black outlined circle. Inactivating phosphorylation events are depicted in black circles with Ps with a red outlined circle.
Figure 4
Figure 4. Regulatory Loops in the Ras/PI3K/PTEN/Akt/mTOR Pathway
Some of the regulatory interactions in the Ras/PI3K/PTEN/Akt/mTOR Pathway are indicated. An activated growth factor receptor is indicated in blue. Ras and Rheb are indicated in dark blue ovals. IRS1 is indicated in an orange oval. Kinases are indicated in green ovals with the exception of GSK-3beta which is indicated in a black oval as it is inactivated by Akt phosphorylation. The p85 regulatory subunit of PI3K is indicated in a red oval. Phosphatases are indicated in black octagons. NF1, TSC1 and TSC2 are indicated in black squares. PIP2 and PIP3 are indicated in yellow ovals. Phosphatases are indicated in black octagons. mTOR interacting proteins which positively regulate mTOR activity are indicated in yellow ovals. mTOR interactiving proteins which negatively regulate mTOR activity are indicated in black ovals. Transcription factors activated by either ERK or Akt phosphorylation are indicated in yellow diamonds. The Foxo transcription factor that is inactivated by Akt phosphorylation is indicated by a black diamond. β-catenin is indicated in an orange rectangle. mRNA initiation factors and proteins associated with the ribosome are indicated in purple ovals. mTORC1 phosphorylates the unc-51-like kinase 1 (ULK1) which results in the suppression of autophagy. ULK1 is indicated in a black oval. The mTORC1 inhibitor prevents phosphorylation of ULK1 and autophagy can occur. Red arrows indicate activating events in pathways. Black arrows indicate inactivating events in pathway. Activating phosphorylation events are depicted in red circles with Ps with a black outlined circle. Inactivating phosphorylation events are depicted in black circles with Ps with a red outlined circle.

Similar articles

Cited by

References

    1. Steelman LS, Chappell WH, Abrams SL, Kempf RC, Long J, Laidler P, Mijatovic S, Maksimovic-Ivanic D, Stivala F, Mazzarino MC, Donia M, Fagone P, Malaponte G, Nicoletti F, Libra M, Milella M, et al. Roles of the Raf/MEK/ERK and PI3K/PTEN/Akt/mTOR pathways in controlling growth and sensitivity to therapy-implications for cancer and aging. Aging. 2011;3:192–222. - PMC - PubMed
    1. Chappell WH, Steelman LS, Long JM, Kempf RC, Abrams SL, Franklin RA, Bäsecke J, Stivala F, Donia M, Fagone P, Malaponte G, Mazzarino MC, Nicoletti F, Libra M, Maksimovic-Ivanic D, Mijatovic S, et al. Ras/Raf/MEK/ERK and PI3K/PTEN/Akt/mTOR inhibitors: Rationale and importance to inhibiting these pathways in human health. Oncotarget. 2011;2:135–164. - PMC - PubMed
    1. McCubrey JA, Steelman LS, Kempf CR, Chappell W, Abrams SL, Stivala F, Malaponte G, Nicoletti F, Libra M, Bäsecke J, Maksimovic-Ivanic D, Mijatovic S, Montalto G, Cervello M, Cocco L, Martelli AM. Therapeutic resistance resulting from mutations in Raf/MEK/ERK and PI3K/PTEN/Akt/mTOR signaling pathways. J Cell Physiol. 2011;226:2762–2781. - PubMed
    1. Little AS, Smith PD, Cook SJ. Mechanisms of acquired resistance to ERK1/2 pathway inhibitors. Oncogene. 2012 May 7; doi: 10.1038/onc.2012.160. - PubMed
    1. Shull AY, Latham-Schwark A, Ramasamy P, Leskoske K, Oroian D, Birtwistle MR, Buckhaults PJ. Novel somatic mutations to PI3K pathway genes in metastatic melanoma. PLoS One. 2012;7:e43369. - PMC - PubMed

Publication types

MeSH terms