. 2012 Nov 9;287(46):38729-40.
doi: 10.1074/jbc.M112.386060. Epub 2012 Sep 24.

Glucose modulates respiratory complex I activity in response to acute mitochondrial dysfunction

Affiliations

Glucose modulates respiratory complex I activity in response to acute mitochondrial dysfunction

Giuseppe Cannino et al. J Biol Chem. .

Abstract

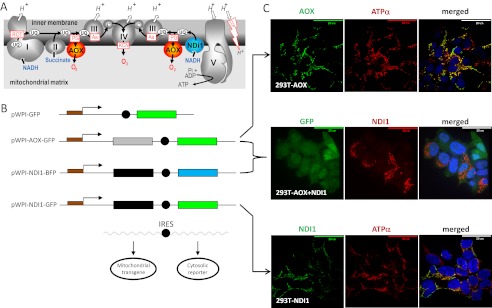
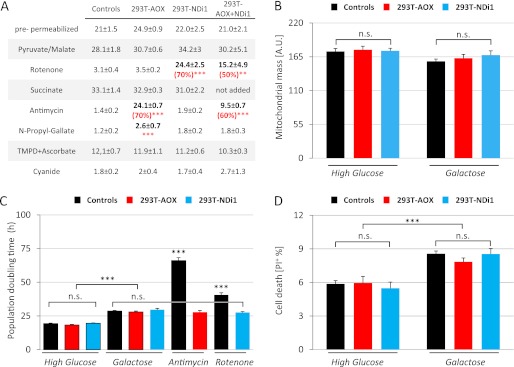
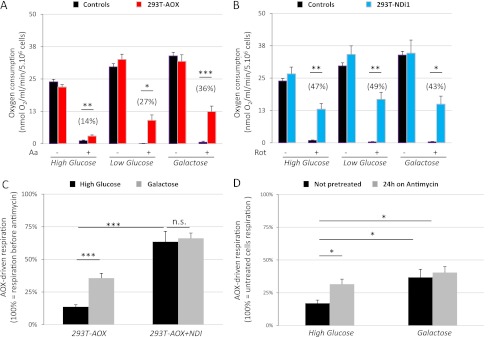
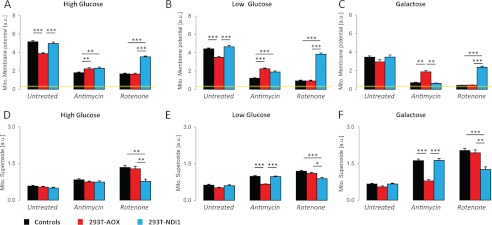
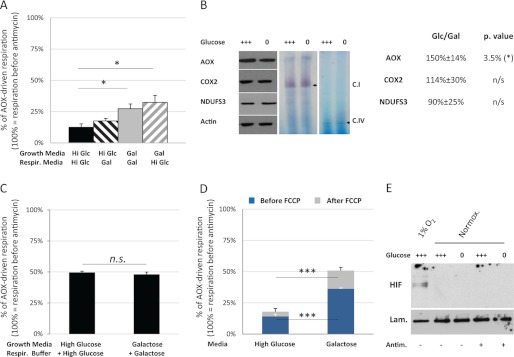
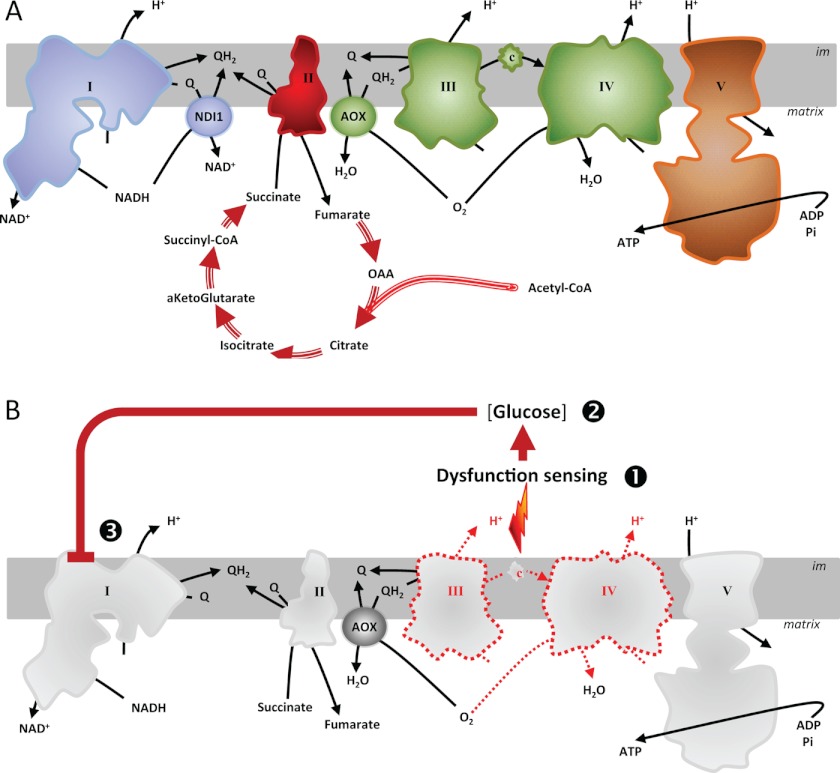
Proper coordination between glycolysis and respiration is essential, yet the regulatory mechanisms involved in sensing respiratory chain defects and modifying mitochondrial functions accordingly are unclear. To investigate the nature of this regulation, we introduced respiratory bypass enzymes into cultured human (HEK293T) cells and studied mitochondrial responses to respiratory chain inhibition. In the absence of respiratory chain inhibitors, the expression of alternative respiratory enzymes did not detectably alter cell physiology or mitochondrial function. However, in permeabilized cells NDI1 (alternative NADH dehydrogenase) bypassed complex I inhibition, whereas alternative oxidase (AOX) bypassed complex III or IV inhibition. In contrast, in intact cells the effects of the AOX bypass were suppressed by growth on glucose, whereas those produced by NDI1 were unaffected. Moreover, NDI1 abolished the glucose suppression of AOX-driven respiration, implicating complex I as the target of this regulation. Rapid Complex I down-regulation was partly released upon prolonged respiratory inhibition, suggesting that it provides an "emergency shutdown" system to regulate metabolism in response to dysfunctions of the oxidative phosphorylation. This system was independent of HIF1, mitochondrial superoxide, or ATP synthase regulation. Our findings reveal a novel pathway for adaptation to mitochondrial dysfunction and could provide new opportunities for combatting diseases.


Figures

FIGURE 1.
FIGURE 1.
AOX and NDI1 provide alternative respiratory pathways in HEK293T cells. A, schematic diagram of the respiratory chain including AOX and NDI1. The mitochondrial respiratory chain conducts the flow of electrons (black arrows) from NADH to oxygen through four respiratory complexes (I–IV, respiratory chain complexes I–IV). Electron transfer between complexes is permitted by specific transporters: ubiquinones (UQ) and cytochrome c (c). Energy produced by the flow of electrons allows pumping of protons (H+) across the inner mitochondrial membrane. Proton re-entry through ATP synthase (V) drives the generation of ATP. CCP, carbonyl cyanide 4-(trifluoromethoxy)phenylhydrazones (e.g., FCCP) are chemical protonophores allowing H+ to cross the otherwise proton-impermeable inner mitochondrial membrane. NDI1 allows electron flow in presence of complex I inhibitors (e.g., rotenone (ROT)), whereas AOX allows electron flow in the presence of inhibitors of complex III (e.g., antimycin (Aa)) or IV (cyanide, KCN). AOX activity is specifically inhibited by n-propyl gallate (PG). B, lentiviral vectors. The pWPI-AOX-GFP lentivector allows co-expression of a cytosolic GFP (under the control of an internal ribosome entry site, black circle) together with C. intestinalis AOX; both are under the control of the EF1α promoter. The pWPI-NDI-GFP is a similar lentiviral vector allowing co-expression of a cytosolic GFP and S. cerevisiae NDI1. The pWPI-NDI-BFP is a modified pWPI-NDI-GFP where the coding sequence of GFP has been replaced by that blue fluorescent protein. C, AOX and NDI1 proteins are localized in mitochondria. Immunofluorescent staining of fixed HEK293T cells transduced as follows. Top panel, cells transduced with pWPI-AOX-GFP. ATPα, subunit α of the mitochondrial ATPase. Bottom panel, HEK293T cells transduced with pWPI-NDI1-GFP. Middle panel, cells transduced with pWPI-AOX-GFP (see top panel) and reinfected with viral particles generated using pWPI-NDI1-BFP. GFP indicates green fluorescent protein (a marker for the pWPI-AOX-GFP transduced cells) (see also supplemental Fig. S1A, top panel). The merged image also shows DAPI nuclear counterstaining. The images are representative pictures (n = 10).
FIGURE 2.
FIGURE 2.
Expression of the alternative pathways does not alter cell physiology. A, alternative respiratory enzymes do not alter substrate-driven oxygen consumption but provide resistance to specific inhibitors. Oxygen consumption, in the presence of ADP, of 5 × 10⁶ digitonin-permeabilized (80 μg/ml) cells after the addition of various respiratory substrates (pyruvate/malate, succinate, and TMPD + ascorbate) and inhibitors (rotenone, antimycin, n-propyl gallate, and cyanide). Measures were performed using a Clark-type electrode, and cells were grown for 24 h in high glucose medium before oxygen consumption analysis. All of the measurements were independently corrected for nonrespiratory oxygen consumption. The data are expressed as the means ± S.E. (error bars). From left to right, n = 8 (4 + 4), 6, 6, and 4. **, p < 0.01; ***, p < 0.001. B, mitochondrial mass is similar in transduced and untransduced cells. Flow cytometric analysis of 10-nonyl acridine orange fluorescence. The cells were grown for 24 h on high glucose or galactose medium before staining. The data are expressed as the means ± S.E. (error bars): controls, n = 24 (12 + 12); 293T-AOX, n = 12; and 293T-NDI1, n = 12. C, alternative respiratory enzymes protect cells exposed to specific respiratory chain inhibitors but do not alter cellular proliferation. For population doubling time, measures were made using a Bürker hemocytometer 72 h after plating. Untreated cells were plated in high glucose (5 × 10⁴/cm2; 293T and 293T-AOX, n = 18; and 293T-NDI1, n = 9) or galactose medium (1 × 10⁵/cm2; 293T, 293T-AOX, and 293T-NDI1, n = 18). Antimycin-treated (30 ng/ml) and rotenone-treated (150 nm) cells were plated in high glucose medium (1 × 10⁵/cm2; 293T, 293T-AOX, and 293T-NDI1 n = 9). Each data point is the average of three independent measurements. The data are expressed as the means ± S.E. (error bars). Important similarities (n.s.) are emphasized. D, alternative respiratory enzymes do not alter cell viability. Flow cytometry of propidium iodide (PI; 2 μg/ml) stained cells. 3 × 10⁵ cells were grown for 24 h in the indicated medium before staining. For controls, n = 21 (293T, 12; and 293T-GFP, 9); and for 293T-AOX and 293T-NDI1, n = 9. The data are expressed as the means ± S.E. (error bars).
FIGURE 3.
FIGURE 3.
In intact cells, AOX-driven respiration is controlled by prior growth in glucose, whereas NDI1-driven respiration is insensitive to glucose. The cells were cultured for 24 h in different media. Respiration was measured with a Clark-type electrode using 5 × 10⁶ intact cells resuspended in the growth medium. The data are expressed as the means ± S.E. (error bars). All of the measurements were independently corrected for nonrespiratory oxygen consumption. *, p < 0.05; **, p < 0.01; ***, p < 0.001. A, in intact cells AOX-driven respiration is repressed by prior growth in glucose. Cellular respiration rates before (Aa −) and after (Aa +) antimycin injection into the oxygraph chamber are shown. The values in parentheses represent antimycin-resistant respiration relative to the respiration observed before the addition of antimycin (see also Fig. 3C). For controls, n = 20 in high glucose (10 + 10), 8 in low glucose (4 + 4), and 9 in galactose (293T, 5; and 293T-GFP, 4). For 293T-AOX, n = 22 in high glucose, 9 in low glucose, and 18 in galactose. B, in intact cells NDI1-driven respiration is insensitive to glucose in the growth medium. Respiration rates before (Rot −) and after (Rot +) rotenone treatment are shown. The values in parentheses represent rotenone-resistant respiration relative to the respiration observed before the addition of rotenone. For each of the tested growth media, n = 7 for controls (293T, 4; and 293T-GFP, 3), and n = 7 for 293T-NDI1. C, in intact cells, when respiration is driven by NDI1 instead of complex I, AOX-driven respiration becomes insensitive to prior growth on glucose. Oxygen consumption by intact cells expressing AOX or AOX + NDI1. The values represent antimycin-resistant respiration rates relative to the respiration observed before the addition of antimycin. For 293T-AOX, n = 22 in high glucose and 18 in galactose; for 293T-AOX + NDI, n = 3 in both media. D, glucose repression of respiration is alleviated after long term exposure to antimycin. Oxygen consumption in intact 293T-AOX cells (5 × 10⁶) grown for 24 h in different media, with or without the addition of 30 ng/ml antimycin. The values represent antimycin-resistant respiration rates relative to the respiration observed before the addition of antimycin. For each cell type and growth medium, n = 7.
FIGURE 4.
FIGURE 4.
Prior growth in glucose influences mitochondrial membrane potential and superoxide production in 293T-AOX cells treated with antimycin but not in 293T-NDI1 cells treated with rotenone. 3 × 10⁵ cells cultured for 24 h in a given medium were treated with antimycin (30 ng/ml) or rotenone (150 nm) or mock-treated for 5 min prior to and during the incubation with the fluorescent indicator (MitoSox, 2.5 μm for 45 min at 37 °C; TMRM, 200 nm for 30 min at 37 °C). Fluorescence was analyzed by flow cytometry. A–C, mitochondrial membrane potential. Flow cytometry analysis of TMRM-stained (emission, 620 ± 15 nm) cells. The data are expressed as the means ± S.E. (error bars). For each cell population and treatment: A, n = 14; B, n = 10; and C, n = 6. Yellow line, TMRM intensity after FCCP (1 μm) uncoupling. D–F, superoxide production. Flow cytometry analysis of MitoSox-stained (emission, 620 ± 15 nm) cells. The data are expressed as the means ± S.E. (error bars). For each cell population and treatment: D, n = 13; E, n = 19; and F, n = 9.
FIGURE 5.
FIGURE 5.
Characteristics of the glucose-dependent down-regulation of complex I induced by complex III inhibition. A, following complex III inhibition, and complex I is slowly inhibited by glucose but rapidly activated by galactose. Respiration of 5 × 10⁶ 293T-AOX cells grown in the indicated “growth media” was measured in the indicated “respiration media” using a Clark-type electrode. Hi Glc, high glucose media; Gal, galactose media. AOX-driven respiration is presented as a proportion of the respiration detected before antimycin treatment. The data are expressed as the means ± S.E. (error bars). For each cell type and assay condition, n = 10. B, growth in glucose does not alter complex I quantity nor in-gel complex I activity in extracts from antimycin-treated cells. Left panel, representative immunoblots showing AOX, complex IV (COX2), complex I (NDUFS3), and actin from post-nuclear extracts of 293T-AOX cells grown for 24 h in high glucose (+++) or galactose (0) medium and then antimycin-treated (30 ng/ml) for 10 min before protein extraction. For each cell type and assay condition, n = 4. Middle and right panels, complex I and complex IV, respectively, in-gel activity from mitochondrial extracts of 293T-AOX cells grown for 24 h in high glucose (+++) or galactose (0) medium and treated with antimycin (30 ng/ml) for 10 min before protein extraction. For each cell type and assay condition, n = 3. Table panel, estimated changes in AOX, complex I (NDUFS3), and complex IV (COX2) amounts after antimycin treatment (30 ng/ml, 10 min) of cells grown for 24 h on high glucose or galactose medium (Glc/Gal). The measurements were obtained from densitometry of nonsaturated autoradiographs and normalized to the signal for actin (e.g., Fig. 5B). For each cell type and assay condition, n = 4. C, complex I regulation by glucose depends on an indirect mechanism. Oxygen consumption by 5 × 10⁶ digitonin-permeabilized cells previously grown for 24 h in high glucose or galactose medium was measured using a Clark-type electrode and a respiratory buffer supplemented with the sugar from the corresponding growth medium. Respiration was measured before and after the addition of antimycin (30 ng/ml) to the oxygraph chamber, as well as after full inhibition of the respiratory chain. AOX-driven respiration is presented as a proportion of the respiration prior to antimycin treatment. The measurements were independently corrected for nonrespiratory oxygen consumption. The data are expressed as the means ± S.E. (error bars). For each cell type and assay condition, n = 8. D, uncoupling does not alter glucose regulation of complex I after antimycin inhibition. Oxygen consumption by 5 × 10⁶ intact 293T-AOX cells previously grown for 24 h in high glucose or galactose medium was measured using a Clark-type electrode, in the corresponding growth medium. Cells, antimycin (30 nm), and FCCP (1 μm) were successively added to the oxygraph chamber. AOX-driven respiration is shown as a proportion of the respiration prior to antimycin treatment. The measurements were independently corrected for nonrespiratory oxygen consumption. The data are expressed as the means ± S.E. (error bars). For each cell type and assay condition, n = 7. E, glucose regulation of mitochondrial function following complex III inhibition is HIF1 independent. Immunoblot for HIF1α in nuclear extracts of 293T-AOX cells grown for 24 h on high glucose (+++) or galactose (0) medium. Cells exposed to low (1%) or atmospheric O2 in presence or absence of antimycin (30 ng/ml, 10 min). Lam., lamin loading control; Normox., normoxic. Representative immunoblot, n = 3.
FIGURE 6.
FIGURE 6.
A, the alternative enzymes are respiratory bypass enzymes. Blue, respiratory complex (complex I) bypassed by NDI1; green, respiratory complexes (complexes III and IV) bypassed by AOX; brown, respiratory complex (complex V) bypassed by the simultaneous activity of AOX and NDI1; red, activities that cannot be bypassed by these alternative enzymes in any combination. Inhibition or down-regulation of a complex will be suppressed in presence of the correct bypass enzyme. B, cells can adapt to dysfunction of complexes III and/or IV by modulating complex I activity according to their metabolic fuel. In response to complex III and IV dysfunction, cells can decrease electron transfer through the respiratory chain by down-regulation of complex I activity. The extent of such inhibition is proportional to the glucose availability, but glucose itself is not the regulatory molecule.

References

    1. DiMauro S. (2004) Mitochondrial diseases. Biochim. Biophys. Acta 1658, 80–88 - PubMed
    1. Zeviani M., Carelli V. (2007) Mitochondrial disorders. Curr. Opin. Neurol. 20, 564–571 - PubMed
    1. DiMauro S., Schon E. A. (2008) Mitochondrial disorders in the nervous system. Annu. Rev. Neurosci. 31, 91–123 - PubMed
    1. Marroquin L. D., Hynes J., Dykens J. A., Jamieson J. D., Will Y. (2007) Circumventing the Crabtree effect. Replacing media glucose with galactose increases susceptibility of HepG2 cells to mitochondrial toxicants. Toxicol. Sci. 97, 539–547 - PubMed
    1. Díaz-Ruiz R., Avéret N., Araiza D., Pinson B., Uribe-Carvajal S., Devin A., Rigoulet M. (2008) Mitochondrial oxidative phosphorylation is regulated by fructose 1,6-bisphosphate. A possible role in Crabtree effect induction? J. Biol. Chem. 283, 26948–26955 - PubMed

Publication types

MeSH terms

LinkOut - more resources