. 2012 Nov 9;287(46):39263-74.
doi: 10.1074/jbc.M112.398834. Epub 2012 Sep 24.

Disruption of wave-associated Rac GTPase-activating protein (Wrp) leads to abnormal adult neural progenitor migration associated with hydrocephalus

Affiliations

Disruption of wave-associated Rac GTPase-activating protein (Wrp) leads to abnormal adult neural progenitor migration associated with hydrocephalus

Il Hwan Kim et al. J Biol Chem. .

Abstract

Hydrocephalus is the most common developmental disability and leading cause of brain surgery for children. Current treatments are limited to surgical intervention, as the factors that contribute to the initiation of hydrocephalus are poorly understood. Here, we describe the development of obstructive hydrocephalus in mice that are null for Wrp (Srgap3). Wrp is highly expressed in the ventricular stem cell niche, and it is a gene required for cytoskeletal organization and is associated with syndromic and psychiatric disorders in humans. During the postnatal period of progenitor cell expansion and ventricular wall remodeling, loss of Wrp results in the abnormal migration of lineage-tagged cells from the ventricular region into the corpus callosum. Within this region, mutant progenitors appear to give rise to abnormal astroglial cells and induce periventricular lesions and hemorrhage that leads to cerebral aqueductal occlusion. These results indicate that periventricular abnormalities arising from abnormal migration from the ventricular niche can be an initiating cause of noncommunicating hydrocephalus.


Figures

FIGURE 1.
FIGURE 1.
Wrp KO mice exhibit perinatal-onset hydrocephalus. A, P40 Wrp KO mouse displays dome-shaped head. B, intracranial magnetic resonance images using P77 Wrp KO mice and their WT littermates. Horizontal and sagittal views demonstrate enlarged ventricles in Wrp KO mice. Scale bar, 1 mm. C, representative surface renderings of the ventricular system from WT (left) and Wrp KO (right) mice generated from magnetic resonance imaging datasets. D, Nissl staining with developing postnatal brains from WT and KO. Coronal sections of P5, P9, P12, and P40 show a gradual increase of LV size in KO mice. Scale bar, 2 mm. E, quantification of LV area reveals that Wrp KO are normal at P5 and slightly enlarged at P9 (statistically insignificant). By P12, however, the LV size of KO is significantly increased compared with that of WT. *, p < 0.01. F, CSF circulating assay with P40 WT and Wrp KO mice. Evans blue dye infused into the LV is visible in the spinal cord of WT mice, whereas no stain is detected in that of KO mice (blue arrows, left panel). Serial sections show that Evans blue dye stains the entire ventricular cavities from LV level to 4th ventricle (red arrows) in WT mice. However, in KO mice, the dye is absent from the aqueduct. 3rd V, third ventricle; LV, lateral ventricle; Aq, aqueduct; 4th V, fourth ventricle.
FIGURE 2.
FIGURE 2.
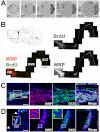
WRP is expressed in the ventricular stem cell niche. A, in situ hybridization histochemistry detecting Wrp within developing brains. Wrp mRNA is highly expressed in the ventricular zone (arrows) as well as olfactory bulb (arrowhead), hippocampus, and cerebellum throughout the postnatal development. Note the dense labeling in the LVs at perinatal stage (P3 to P12). OB, olfactory bulb; Hip, hippocampus; CB, cerebellum. Scale bar, 5 mm. B, sagittal brain map showing the SVZ lining and RMS stack (red dots). Double immunostaining demonstrates that the expression pattern of WRP is very similar to BrdU signals in the ventricular niche area. RMS, rostral migratory stream; SVZ, subventricular zone. Scale bar, 500 μm. C, double labeling for WRP and DCX in RMS reveals that WRP protein is highly expressed in RMS where DCX-positive neuroblasts are located. Z-stack imaging (right panel) shows WRP expression in a subpopulation of DCX-positive cells within the RMS. Scale bar, 100 μm. D, immunostaining shows strong WRP immunoreactivity in the SVZ (arrows) but not in the DCX-negative cell population (arrowheads). Z-stack imaging (right panel) shows WRP expression in a subpopulation of DCX-positive cells in SVZ. Scale bars, 100 μm.
FIGURE 3.
FIGURE 3.
Knock-out of Wrp in the ventricular niche induces the hydrocephalic phenotype. A and H, Nissl staining of sagittal sections from P40 Wrpflox/flox:N4CreER and Wrpflox/flox:N4CreER+ mice. Red box indicates dorsal part, and blue box indicates ventral part of the LVs. A, control Wrpflox/flox:N4CreER mice display a normal dorsal LV morphology. Scale bar, 1 mm. H, Wrpflox/flox:N4CreER+ mice show an enlarged LV and an abnormal cell mass within the ventral region of the LV (green arrow). B–D, immunohistochemical analysis shows DCX-positive neuroblasts, and Nestin-positive cells are predominantly localized in the SVZ and RMS of Wrpflox/flox:N4CreER mice. Dense Nestin signals in the ependyma and moderate signals in SVZ are observed in Wrpflox/flox:N4CreER mice, and evenly distributed DCX signals are detected in RMS and SVZ. Cpu, caudate putamen. Scale bar, 100 μm. E–G, control Wrpflox/flox:N4CreER displays normal shape of ventral region of LV with AQP1 signals only in the choroid plexus. cp, choroid plexus. I, in Wrpflox/flox:N4CreER+, however, a large portion of neuroblasts are observed along the CC area (white arrows) and ventral part of the LV (arrowhead). J, strong Nestin immunoreactivity is also observed in the CC and ventral LV area aside from the ependyma and the SVZ in Wrpflox/flox:N4CreER+ mice. K, both DCX and Nestin signals are evenly distributed in ependyma, SVZ, and ventral LV. Arrowheads indicate the expression of DCX and Nestin in the abnormal cell mass located in ventral LV. A subpopulation of Nestin-positive cells in CC area also express DCX (insets). Scale bar, 20 μm. Asterisks indicate enlarged LV. L–N, Wrpflox/flox:N4CreER+ shows abnormal cell mass in which partial Nestin- and AQP1-positive signals are detected. Note the partial tissue damage around the cell mass (yellow arrows). Scale bar, 200 μm.
FIGURE 4.
FIGURE 4.
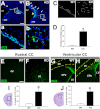
Aberrant migration of progenitor cells following Wrp deletion. A–D, mis-localization of DCX-positive neuroblasts of the ventricular zone and the RMS in P40 Wrp KO mice. A, WT sagittal section shows specific and normal localization of DCX-positive cells in the SVZ and RMS. Scale bar, 200 μm. Panel a, angles of each neuroblasts are homogeneously organized through the RMS track. Scale bar, 50 μm. B, Wrp KO mice show mis-localized neuroblasts in the CC above the dorsal plate of the LV (arrows) and stacked neuroblasts at the entry point of RMS (yellow arrowhead). Panel b, high magnification view of the RMS shows dispersed and misoriented neuroblasts in KO RMS when compared with WT. C, representative cell angles (matching to panels a and b) showing the orientation of each neuroblast based on DCX staining in the RMS for WT (left) and KO (right). D, quantification reveals that the angle variation (standard deviation) of the KO cell orientation in the RMS is significantly higher than that of WT. E–J, mis-localization of neuroblasts in P9 Wrp KO mice. Coronal brain sections of WT mice show very little evidence of DCX-positive cells in the rostral (E) or ventricular CC (G) regions. In contrast, Wrp KO mice exhibit extensive DCX-positive neuroblasts in the rostral (F) and ventricular CC (between yellow dashed lines) H, representative brain slices (left side of graphs) represent the areas (boxed region) used for measuring DCX-positive cells. Quantification reveals a significant increase of DCX-positive cells in the KO CC both in the rostral and ventricular CC (red arrowheads) when compared with WT (I and J). Scale bar, 200 μm. EP, ependyma; CPu, caudate putamen; CC, corpus callosum. *, p < 0.01.
FIGURE 5.
FIGURE 5.
Abnormal cell migration from the ventricular wall region into the corpus callosum in Wrp KO mice. A–C, fluorescent nano-bead injection into the ventricles of P5 mice followed by tracing of the beads at P12. A, beads are observed in the WT LV wall and the entry point to the RMS (yellow arrow). Ep, ependyma. Scale bar, 50 μm. B, in KO mice, however, a large portion of the beads is detected in the CC as well as in the ependymal layer. Panels a and b, densitometry plots showing the distribution of the beads in the CC area of the WT and KO mice. C, quantification reveals identical bead density between WT and KO in the ependymal layer (bottom), yet a significant increase in beads in the CC of KO mice. *, p < 0.0001. D–G, representative images (two WT and two KO) of lineage tracing by lentiviral infection of the LV wall. D and E, infected cells (infection at P3) are detected only in the ventricular wall of WT (arrowheads) at P12. Scale bar, 50 μm. F, however, in the KO mice, the infected cells are observed in CC area (white arrows). Note that these cells express Nestin. G, subpopulation of the infected cells show astrocyte-like morphology (white arrow). High magnification Z-stack image view of the boxed region demonstrates co-localization of the tdTomato and the Nestin signals in the cells (right panel). Scale bar, 20 μm. H and J, tdTomato-positive cells are detected in olfactory bulb of WT and KO. OB, olfactory bulb; GL, glomerular layer; EPL, external plexiform layer; MCL, mitral cell layer; GCL, granule cell layer. Scale bar, 100 μm. I and K, high magnification view shows neuronal morphology of the tdTomato-positive cells in olfactory bulb. Scale bar, 20 μm.
FIGURE 6.
FIGURE 6.
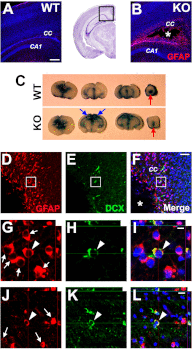
Corpus callosum damage precedes the blockage of the ventricular cavity. A–C, brain image on the top panel represents the hippocampal level of corpus callosum (box) that is used for immunostaining. A, at P9 WT shows no tissue disruption and expresses little GFAP in the CC area. Scale bar, 200 μm. B, P9 KO exhibits ectopic cystic cavity (asterisk mark) in the CC above the hippocampus with a high expression of GFAP. C, in this period (P9), both WT and KO display Evans blue stain in aqueduct (red arrows), indicating an open aqueduct. Note the blue stains in the ectopic cavities above the KO hippocampi (blue arrows). D–I, GFAP- and DCX-double positive cells around the cystic cavity. High magnification view of P9 KO brain shows an elevated level of GFAP-positive astrocytes (D) and DCX-positive neuroblasts (E). F, double-positive cells are observed in subcystic cavity area. Asterisk, cystic cavity; scale bar, 100 μm. Higher magnified Z-stack images of the region (white boxes) clearly show individual GFAP-positive cells (white arrows) (G) and DCX-positive cell (H). I, subpopulation of GFAP-positive cells also express DCX (white arrowhead). Scale bar, 10 μm. J–L, Z-stack images of rostral CC demonstrate GFAP-positive astrocytes (arrows) (J) and DCX (K) in P9 KO mice. Merged image demonstrates subpopulation of GFAP-positive cells express DCX (arrowhead) (L). Scale bars, 20 μm.
FIGURE 7.
FIGURE 7.
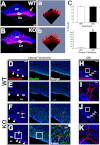
Astrogliosis in the corpus callosum and the ventral LV of the Wrp KO mice. A–F, H&E staining shows astrogliosis in CC area of P40 Wrp KO mice. Normal morphology in rostral (A), ventricular zone (B), and hippocampal (C) region of the CC in WT mice. D–F, CC areas in Wrp KO mice are damaged, whereas the cortex, caudate putamen (E), and the hippocampus (F) appear normal. High magnification views show astrogliosis throughout the CC area (right panels of D and E). Note that axonal debris is released from the CC region into the ventricles (right panel of F). cc, corpus callosum; CPu, caudate putamen. Scale bars, 1 mm (left panel); 500 μm (middle panel); 200 μm (right panel). G, focal hemorrhages in the corpus callosum of Wrp KO mice. Sequential high magnification views (yellow and blue boxes) with perfused (nonstained) P40 Wrp KO brain sections clearly display bleeding in the deep ventrolateral part of the CC (red arrow). H–K, astroglial cell mass in the ventral part of LV in Wrp KO mice. H, DAPI staining with sagittal section from KO brain reveals the abnormal cell mass (white box) in the ventral part of LV with partial tissue damage (arrows). Scale bar, 500 μm. Immunostaining shows that AQP1 (I) and EphA2 (J) are expressed in the central part of the abnormal cell mass. K, both signals partially merged with each other.
FIGURE 8.
FIGURE 8.
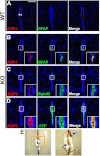
Aqueduct of Wrp KO mouse (P40) is blocked by astrogliosis, axonal debris, and hemorrhage. A, WT shows no AQP1/GFAP-positive debris inside the aqueduct. Aq, aqueduct. Scale bar, 100 μm. B, KO mice show aqueductal obstructions that are positive for AQP1/GFAP. C, KO mice show aqueductal obstructions that are positive for AQP1/EphA2. The substances inside of aqueduct are nucleus-free debris. D, KO mice also show APP-positive nucleus-free axonal debris inside of the aqueduct. E, hemorrhages are observed in the KO aqueduct. High magnification view (orange box) shows the existence of the hemorrhage inside of the aqueduct (blue arrows).
FIGURE 9.
FIGURE 9.
AraC treatment relieves ventricle enlargement in Wrp KO mice. A, KO mice treated with saline at P5 exhibit increased brain size (upper panel) with profoundly enlarged ventricles at P25 (lower panel). Scale bar, 2 mm. B, AraC-treated (at P5) KO brains are smaller than saline-treated KO brains (upper panel). Nissl staining shows reduced ventricle size compared with control KO brains (lower panel). C, graph of ventricle size reveals that AraC-treated KO ventricular size is significantly smaller than that of saline-treated KO controls. *, p < 0.01. D, saline-treated (at P5) control mice show evenly distributed expressions of Ki-67 in Nestin-positive ventricular niche at P9. High magnification views (right panels) show nuclear localization of Ki-67 combined with cytoplasmic Nestin signals. E, Ki-67-positive proliferating cells in entry point of RMS (yellow arrows) are reduced by the treatment of AraC. Scale bars, 50 μm (1st column), 20 μm (2nd column).
FIGURE 10.
FIGURE 10.
Schematic showing the sequence of events leading to hydrocephalus development in the Wrp KO mice. Developmental sequence of hydrocephalus is shown from top to bottom. Relative age of mice corresponding to each event leading to hydrocephalus is shown in brackets. Aq, aqueduct.

References

    1. Beni-Adani L., Biani N., Ben-Sirah L., Constantini S. (2006) The occurrence of obstructive vs. absorptive hydrocephalus in newborns and infants. Relevance to treatment choices. Childs Nerv. Syst. 22, 1543–1563 - PubMed
    1. Banizs B., Pike M. M., Millican C. L., Ferguson W. B., Komlosi P., Sheetz J., Bell P. D., Schwiebert E. M., Yoder B. K. (2005) Dysfunctional cilia lead to altered ependyma and choroid plexus function and result in the formation of hydrocephalus. Development 132, 5329–5339 - PubMed
    1. Davy B. E., Robinson M. L. (2003) Congenital hydrocephalus in hy3 mice is caused by a frameshift mutation in Hydin, a large novel gene. Hum. Mol. Genet. 12, 1163–1170 - PubMed
    1. Ibañez-Tallon I., Pagenstecher A., Fliegauf M., Olbrich H., Kispert A., Ketelsen U. P., North A., Heintz N., Omran H. (2004) Dysfunction of axonemal dynein heavy chain Mdnah5 inhibits ependymal flow and reveals a novel mechanism for hydrocephalus formation. Hum. Mol. Genet. 13, 2133–2141 - PubMed
    1. Lindeman G. J., Dagnino L., Gaubatz S., Xu Y., Bronson R. T., Warren H. B., Livingston D. M. (1998) A specific, nonproliferative role for E2F-5 in choroid plexus function revealed by gene targeting. Genes Dev. 12, 1092–1098 - PMC - PubMed

Publication types