Review
. 2012 Dec;22(4):313-33.
doi: 10.1007/s11065-012-9214-1. Epub 2012 Sep 25.

Brain development during the preschool years

Affiliations
Review

Brain development during the preschool years

Timothy T Brown et al. Neuropsychol Rev. 2012 Dec.

Abstract

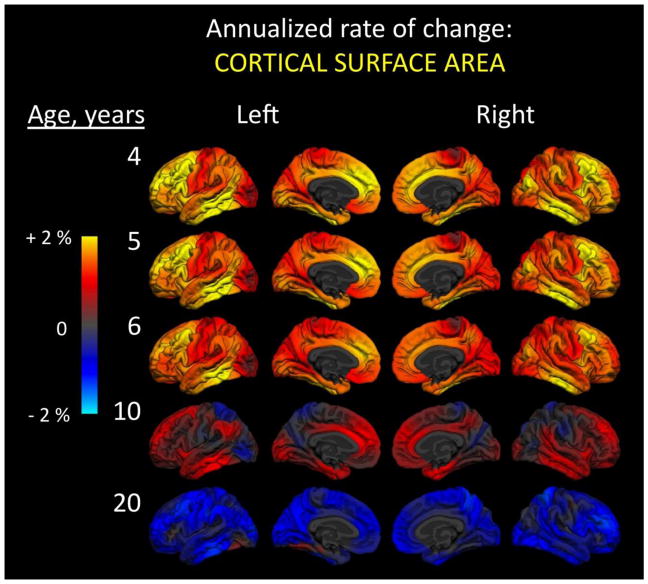
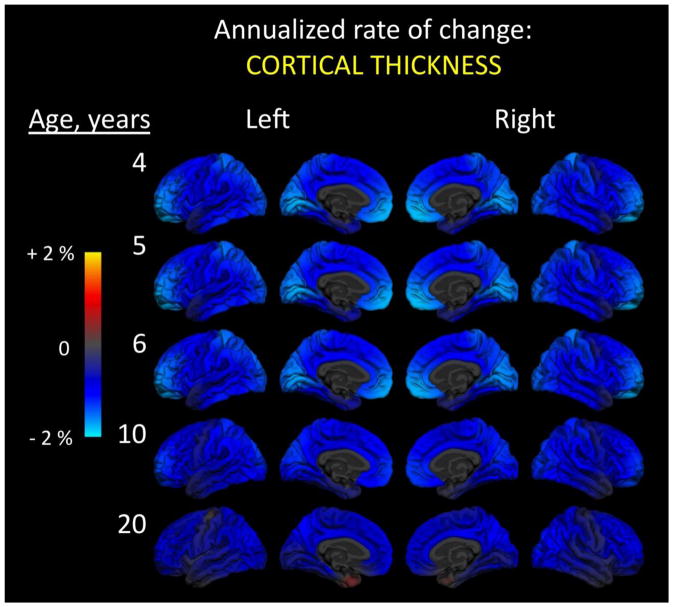
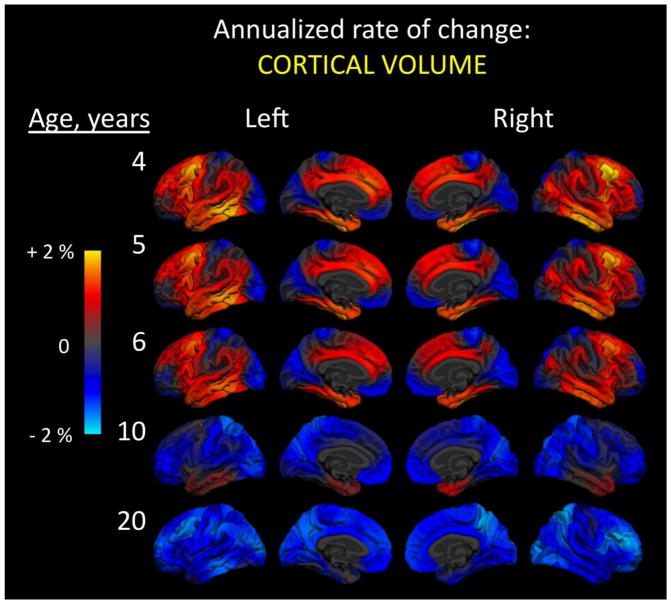
The preschool years represent a time of expansive mental growth, with the initial expression of many psychological abilities that will continue to be refined into young adulthood. Likewise, brain development during this age is characterized by its "blossoming" nature, showing some of its most dynamic and elaborative anatomical and physiological changes. In this article, we review human brain development during the preschool years, sampling scientific evidence from a variety of sources. First, we cover neurobiological foundations of early postnatal development, explaining some of the primary mechanisms seen at a larger scale within neuroimaging studies. Next, we review evidence from both structural and functional imaging studies, which now accounts for a large portion of our current understanding of typical brain development. Within anatomical imaging, we focus on studies of developing brain morphology and tissue properties, including diffusivity of white matter fiber tracts. We also present new data on changes during the preschool years in cortical area, thickness, and volume. Physiological brain development is then reviewed, touching on influential results from several different functional imaging and recording modalities in the preschool and early school-age years, including positron emission tomography (PET), electroencephalography (EEG) and event-related potentials (ERP), functional magnetic resonance imaging (fMRI), magnetoencephalography (MEG), and near-infrared spectroscopy (NIRS). Here, more space is devoted to explaining some of the key methodological factors that are required for interpretation. We end with a section on multimodal and multidimensional imaging approaches, which we believe will be critical for increasing our understanding of brain development and its relationship to cognitive and behavioral growth in the preschool years and beyond.


Figures

Figure 1
Figure 1
Annualized rate of change in cortical surface area. At every vertex across the reconstructed cortical surface, age-dependent annualized rate of change is shown at five different ages. Left and right hemisphere lateral (outside) and medial (inside) surfaces are shown. Color scale ranges from two percent increases (yellow) to two percent decreases (cyan) in area. Change was calculated using 202 subjects (102 male, 100 female): 26 four-year-olds (12 males, 14 females); 20 five-year-olds (11 males, 9 females); 37 six-year-olds (20 males, 17 females); 48 10-year-olds (26 males, 22 females); and 71 20-year-olds (33 males, 38 females). Data come from the Pediatric Imaging, Neurocognition, and Genetics (PING) Study, adapted from Brown et al., 2012.
Figure 2
Figure 2
Annualized rate of change in cortical thickness. At every vertex across the reconstructed cortical surface, age-dependent annualized rate of change is shown at five different ages. Left and right hemisphere lateral (outside) and medial (inside) surfaces are shown. Color scale ranges from two percent increases (yellow) to two percent decreases (cyan) in thickness. Change was calculated using 202 subjects (102 male, 100 female): 26 four-year-olds (12 males, 14 females); 20 five-year-olds (11 males, 9 females); 37 six-year-olds (20 males, 17 females); 48 10-year-olds (26 males, 22 females); and 71 20-year-olds (33 males, 38 females). Data come from the Pediatric Imaging, Neurocognition, and Genetics (PING) Study, adapted from Brown et al., 2012.
Figure 3
Figure 3
Annualized rate of change in cortical volume. At every vertex across the reconstructed cortical surface, age-dependent annualized rate of change is shown at five different ages. Left and right hemisphere lateral (outside) and medial (inside) surfaces are shown. Color scale ranges from two percent increases (yellow) to two percent decreases (cyan) in volume. Change was calculated using 202 subjects (102 male, 100 female): 26 four-year-olds (12 males, 14 females); 20 five-year-olds (11 males, 9 females); 37 six-year-olds (20 males, 17 females); 48 10-year-olds (26 males, 22 females); and 71 20-year-olds (33 males, 38 females). Data come from the Pediatric Imaging, Neurocognition, and Genetics (PING) Study, adapted from Brown et al., 2012.

References

    1. Allen P, Stephan KE, Mechelli A, Day F, Ward N, Dalton J, Williams SC, McGuire P. Cingulate activity and fronto-temporal connectivity in people with prodromal signs of psychosis. Neuroimage 2009 - PMC - PubMed
    1. Alonso-Solis A, Corripio I, de Castro-Manglano P, Duran-Sindreu S, Garcia-Garcia M, Proal E, Nunez-Marin F, Soutullo C, Alvarez E, Gomez-Anson B, Kelly C, Castellanos FX. Altered default network resting state functional connectivity in patients with a first episode of psychosis. Schizophrenia Research. 2012;139:13–18. - PMC - PubMed
    1. Bandettini PA, Jesmanowicz A, Wong EC, Hyde JS. Processing strategies for time-course data sets in functional MRI of the human brain. Magnetic Resonance in Medicine. 1993;30:161–173. - PubMed
    1. Barkovich AJ. Concepts of myelin and myelination in neuroradiology. AJNR Am J Neuroradiol. 2000;21:1099–1109. - PMC - PubMed
    1. Barkovich AJ. Magnetic resonance techniques in the assessment of myelin and myelination. J Inherit Metab Dis. 2005;28:311–343. - PubMed

Publication types