. 2012 Dec;34(6):660-70.
doi: 10.1097/FTD.0b013e3182708edf.

Pharmacokinetics of tacrolimus during pregnancy

Affiliations

Pharmacokinetics of tacrolimus during pregnancy

Songmao Zheng et al. Ther Drug Monit. 2012 Dec.

Abstract

Background: Information on the pharmacokinetics of tacrolimus during pregnancy is limited to case reports despite the increasing number of pregnant women being prescribed tacrolimus for immunosuppression.

Methods: Blood, plasma, and urine samples were collected over 1 steady-state dosing interval from women treated with oral tacrolimus during early to late pregnancy (n = 10) and postpartum (n = 5). Total and unbound tacrolimus as well as metabolite concentrations in blood and plasma were assayed by a validated liquid chromatography/mass spectrometry/mass spectrometry (LC/MS/MS) method. A mixed-effect linear model was used for comparison across gestational age and using postpartum as the reference group.

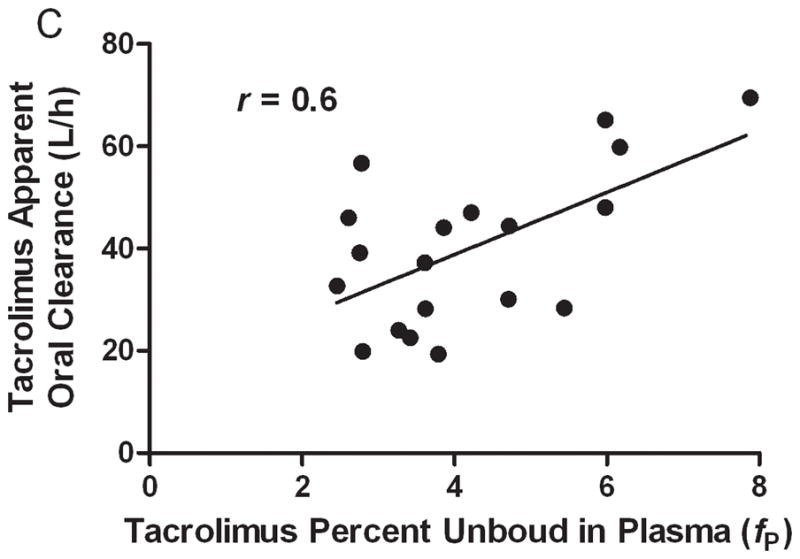
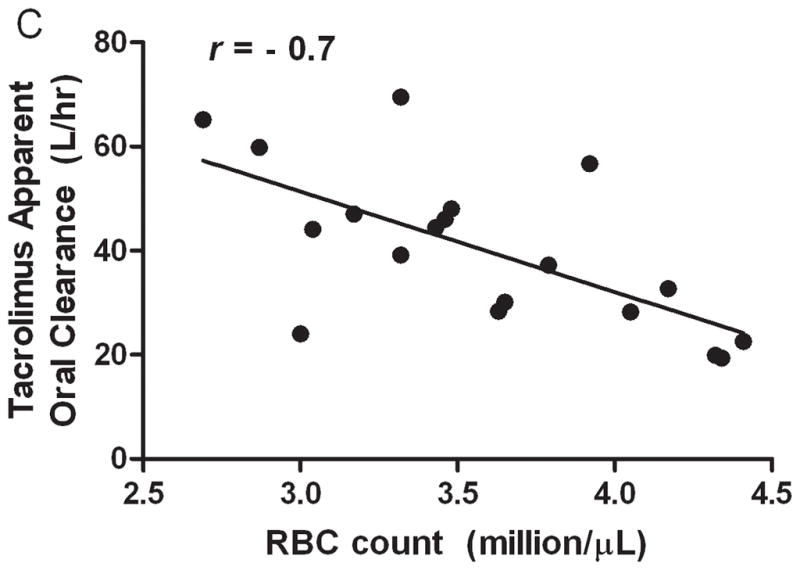
Results: The mean oral clearance (CL/F) based on whole-blood tacrolimus concentration was 39% higher during mid-pregnancy and late pregnancy compared with postpartum (47.4 ± 12.6 vs. 34.2 ± 14.8 L/h, P < 0.03). Tacrolimus-free fraction increased by 91% in plasma (f(P)) and by 100% in blood (f(B)) during pregnancy (P = 0.0007 and 0.002, respectively). Increased fP was inversely associated with serum albumin concentration (r = -0.7, P = 0.003), which decreased by 27% during pregnancy. Pregnancy-related changes in f(P) and f(B) contributed significantly to the observed gestational increase in tacrolimus whole-blood CL/F (r² = 0.36 and 0.47, respectively, P < 0.01). In addition, tacrolimus whole-blood CL/F was inversely correlated with both hematocrit and red blood cell counts, suggesting that binding of tacrolimus to erythrocytes restricts its availability for metabolism. Treating physicians increased tacrolimus dosages in study participants during pregnancy by an average of 45% to maintain tacrolimus whole-blood trough concentrations in the therapeutic range. This led to striking increases in unbound tacrolimus trough concentrations and unbound area under the concentration-time curve, by 112% and 173%, respectively, during pregnancy (P = 0.02 and 0.03, respectively).

Conclusions: Tacrolimus pharmacokinetics are altered during pregnancy. Dose adjustment to maintain whole-blood tacrolimus concentration in the usual therapeutic range during pregnancy increases circulating free drug concentrations, which may impact clinical outcomes.


Conflict of interest statement

The authors declare no conflicts of interest.

Figures

FIGURE 1
FIGURE 1
Tacrolimus blood concentration-time profiles during early- and mid-/late-pregnancy as well as > 3 months postpartum in women treated with tacrolimus every 12 hours (A); and dose-normalized (to 1 mg over 12 hours) tacrolimus blood concentration-time curves (B), and unbound tacrolimus blood concentration-time profile (C). Individual data points on all graphs represent the mean ± SD from study subjects when n > 2. The mean data were presented when n = 2. Only data from subjects with a 12-hour dosing interval were included. The unbound concentration is not available for one subject in late pregnancy due to hemolyzed plasma collections.
FIGURE 2
FIGURE 2
Tacrolimus oral clearance (A) and unbound oral clearance (B) based on AUCblood for subjects during pregnancy (n = 10) and postpartum (n = 5).
FIGURE 2
FIGURE 2
Tacrolimus oral clearance (A) and unbound oral clearance (B) based on AUCblood for subjects during pregnancy (n = 10) and postpartum (n = 5).
FIGURE 3
FIGURE 3
Tacrolimus percent unbound in plasma (A) and blood (B). The correlation between tacrolimus free fraction in plasma and oral clearance (C) and the correlation between free fraction in blood and tacrolimus oral clearance. The free fraction of tacrolimus could not be determined for one subject because of hemolyzed plasma samples.
FIGURE 3
FIGURE 3
Tacrolimus percent unbound in plasma (A) and blood (B). The correlation between tacrolimus free fraction in plasma and oral clearance (C) and the correlation between free fraction in blood and tacrolimus oral clearance. The free fraction of tacrolimus could not be determined for one subject because of hemolyzed plasma samples.
FIGURE 4
FIGURE 4
Serum albumin concentrations during early- (n = 4) and mid-/late-pregnancy (n = 8) as well as postpartum (n = 5) (A) and correlation between serum albumin concentrations and tacrolimus percent unbound in plasma during pregnancy and postpartum (B) in 10 solid organ transplantation recipients.
FIGURE 4
FIGURE 4
Serum albumin concentrations during early- (n = 4) and mid-/late-pregnancy (n = 8) as well as postpartum (n = 5) (A) and correlation between serum albumin concentrations and tacrolimus percent unbound in plasma during pregnancy and postpartum (B) in 10 solid organ transplantation recipients.
FIGURE 5
FIGURE 5
Hematocrit during early- (n = 4) and mid-/late-pregnancy (n = 8) as well as postpartum (n = 5) (A) and correlation between red blood cell counts and mean tacrolimus blood/plasma concentration ratio (B). Correlation between red blood cell counts and tacrolimus oral clearance (C) during pregnancy and postpartum in 10 solid organ transplantation recipients.
FIGURE 5
FIGURE 5
Hematocrit during early- (n = 4) and mid-/late-pregnancy (n = 8) as well as postpartum (n = 5) (A) and correlation between red blood cell counts and mean tacrolimus blood/plasma concentration ratio (B). Correlation between red blood cell counts and tacrolimus oral clearance (C) during pregnancy and postpartum in 10 solid organ transplantation recipients.
FIGURE 6
FIGURE 6
The blood to plasma tacrolimus concentration ratio versus plasma concentration in solid organ transplantation recipients during pregnancy. All measured plasma concentrations were pooled and plotted against the respective blood to plasma concentration ratio.

References

    1. Scott LJ, McKeage K, Keam SJ, et al. Tacrolimus: a further update of its use in the management of organ transplantation. Drugs. 2003;63(12):1247–97. - PubMed
    1. McKay DB, Josephson MA. Pregnancy in recipients of solid organs--effects on mother andchild. N Engl J Med. 2006;354(12):1281–93. - PubMed
    1. Coscia LA, Constantinescu S, Moritz MJ, et al. Report from the National Transplantation Pregnancy Registry (NTPR): outcomes of pregnancy after transplantation. Clin Transpl. 2010:65–85. - PubMed
    1. Jusko WJ, Thomson AW, Fung J, et al. Consensus document: therapeutic monitoring of tacrolimus (FK-506) Ther Drug Monit. 1995;17(6):606–14. - PubMed
    1. Machida M, Takahara S, Ishibashi M, et al. Effect of temperature and hematocrit on plasma concentration of FK 506. Transplant Proc. 1991;23(6):2753–4. - PubMed

Publication types

MeSH terms