

Molecular analysis of model gut microbiotas by imaging mass spectrometry and nanodesorption electrospray ionization reveals dietary metabolite transformations
- PMID: 23009651
- PMCID: PMC3711173
- DOI: 10.1021/ac302039u
Molecular analysis of model gut microbiotas by imaging mass spectrometry and nanodesorption electrospray ionization reveals dietary metabolite transformations
Abstract
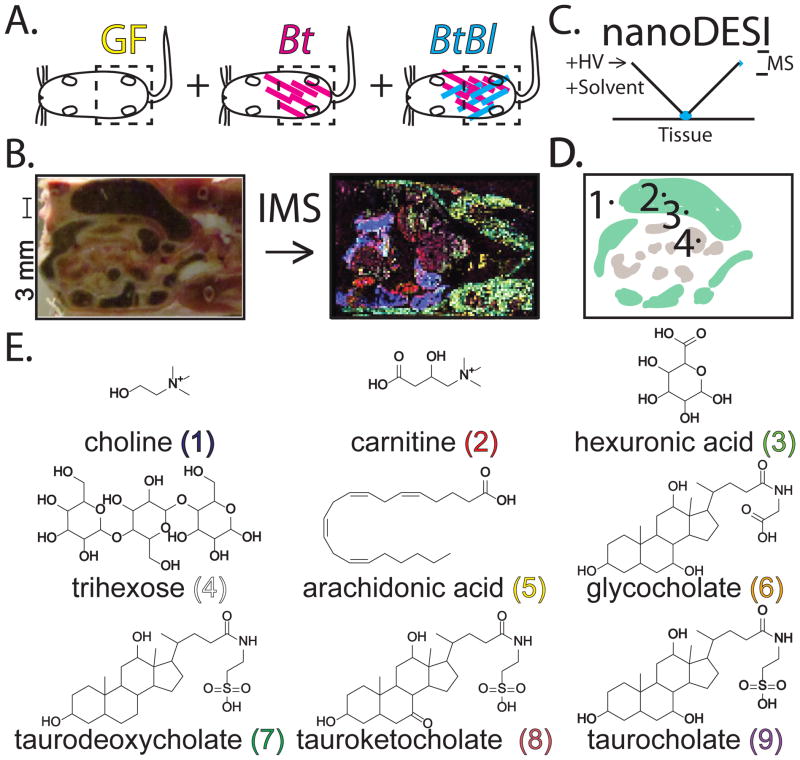
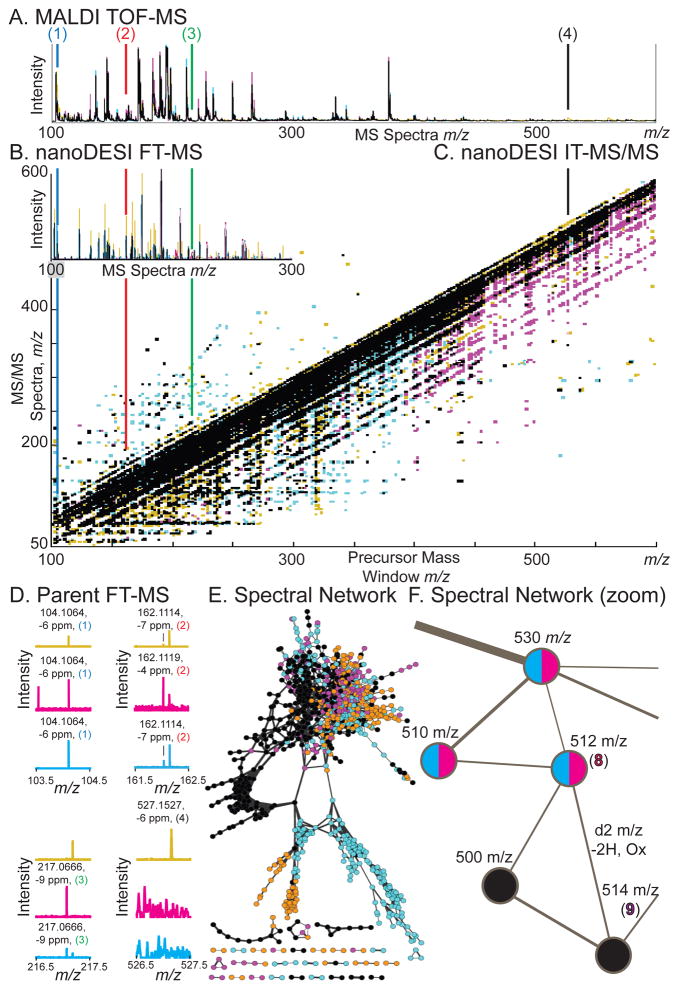
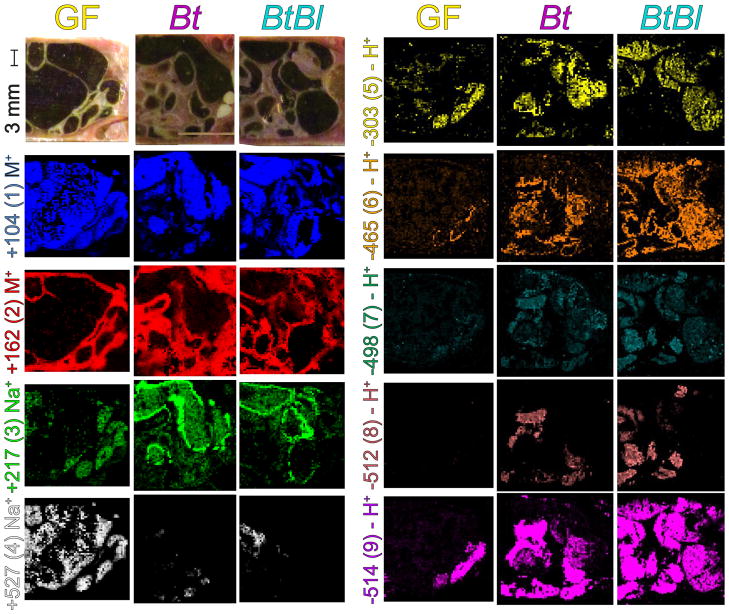
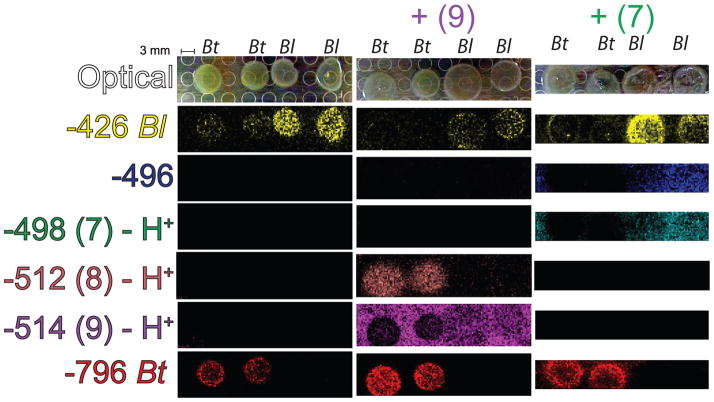
The communities constituting our microbiotas are emerging as mediators of the health-disease continuum. However, deciphering the functional impact of microbial communities on host pathophysiology represents a formidable challenge, due to the heterogeneous distribution of chemical and microbial species within the gastrointestinal (GI) tract. Herein, we apply imaging mass spectrometry (IMS) to localize metabolites from the interaction between the host and colonizing microbiota. This approach complements other molecular imaging methodologies in that analytes need not be known a priori, offering the possibility of untargeted analysis. Localized molecules within the GI tract were then identified in situ by surface sampling with nanodesorption electrospray ionization Fourier transform ion cyclotron resonance-mass spectrometry (nanoDESI FTICR-MS). Products from diverse structural classes were identified including cholesterol-derived lipids, glycans, and polar metabolites. Specific chemical transformations performed by the microbiota were validated with bacteria in culture. This study illustrates how untargeted spatial characterization of metabolites can be applied to the molecular dissection of complex biology in situ.
Figures
Similar articles
-
Distinct signatures of host-microbial meta-metabolome and gut microbiome in two C57BL/6 strains under high-fat diet.ISME J. 2014 Dec;8(12):2380-96. doi: 10.1038/ismej.2014.79. Epub 2014 Jun 6. ISME J. 2014. PMID: 24906017 Free PMC article.
-
Rapid analysis of bile acids in different biological matrices using LC-ESI-MS/MS for the investigation of bile acid transformation by mammalian gut bacteria.Anal Bioanal Chem. 2017 Feb;409(5):1231-1245. doi: 10.1007/s00216-016-0048-1. Epub 2016 Nov 7. Anal Bioanal Chem. 2017. PMID: 27822648
-
A specific gut microbiota and metabolomic profiles shifts related to antidiabetic action: The similar and complementary antidiabetic properties of type 3 resistant starch from Canna edulis and metformin.Pharmacol Res. 2020 Sep;159:104985. doi: 10.1016/j.phrs.2020.104985. Epub 2020 Jun 3. Pharmacol Res. 2020. PMID: 32504839
-
Microbial biotransformations of bile acids as detected by electrospray mass spectrometry.Adv Nutr. 2013 Jan 1;4(1):29-35. doi: 10.3945/an.112.003061. Adv Nutr. 2013. PMID: 23319120 Free PMC article. Review.
-
The Role of the Gut Microbiota in Bile Acid Metabolism.Ann Hepatol. 2017 Nov;16(Suppl. 1: s3-105.):s15-s20. doi: 10.5604/01.3001.0010.5494. Ann Hepatol. 2017. PMID: 29080339 Review.
Cited by
-
Advanced mass spectrometry technologies for the study of microbial pathogenesis.Curr Opin Microbiol. 2014 Jun;19:45-51. doi: 10.1016/j.mib.2014.05.023. Epub 2014 Jul 3. Curr Opin Microbiol. 2014. PMID: 24997399 Free PMC article.
-
Stress as a Normal Cue in the Symbiotic Environment.Trends Microbiol. 2016 May;24(5):414-424. doi: 10.1016/j.tim.2016.02.012. Epub 2016 Mar 20. Trends Microbiol. 2016. PMID: 27004825 Free PMC article. Review.
-
Strain-level functional variation in the human gut microbiota based on bacterial binding to artificial food particles.Cell Host Microbe. 2021 Apr 14;29(4):664-673.e5. doi: 10.1016/j.chom.2021.01.007. Epub 2021 Feb 10. Cell Host Microbe. 2021. PMID: 33571448 Free PMC article.
-
Mass Spectrometry Imaging Reveals Elevated Glomerular ATP/AMP in Diabetes/obesity and Identifies Sphingomyelin as a Possible Mediator.EBioMedicine. 2016 May;7:121-34. doi: 10.1016/j.ebiom.2016.03.033. Epub 2016 Mar 28. EBioMedicine. 2016. PMID: 27322466 Free PMC article.
-
Data-independent microbial metabolomics with ambient ionization mass spectrometry.J Am Soc Mass Spectrom. 2013 Aug;24(8):1167-76. doi: 10.1007/s13361-013-0608-y. Epub 2013 Apr 9. J Am Soc Mass Spectrom. 2013. PMID: 23568029 Free PMC article.
References
-
- Sekirov I, Russell SL, Antunes LCM, Finlay BB. Physiol Rev. 2010;90(3):859–904. - PubMed
-
- France de La Cochetiere M, Rouge C, Darmaun D, Christophe Roze J, Potel G, Gras Leguen C. Cur Ped Rev. 2007;3(1):21–34.
Publication types
MeSH terms
Substances
Grants and funding
LinkOut - more resources
Full Text Sources
Other Literature Sources
