

doi: 10.1021/ci300293f.
Epub 2012 Sep 26.
Plane of best fit: a novel method to characterize the three-dimensionality of molecules
Affiliations
- PMID: 23009689
- PMCID: PMC3477823
- DOI: 10.1021/ci300293f
Item in Clipboard
Plane of best fit: a novel method to characterize the three-dimensionality of molecules
J Chem Inf Model.
.
Free PMC article
Abstract
We describe a computational method, plane of best fit (PBF), to quantify and characterize the 3D character of molecules. This method is rapid and amenable to analysis of large diverse data sets. We compare PBF with alternative literature methods used to assess 3D character and apply the method to diverse data sets of fragment-like, drug-like, and natural product compound libraries. We show that exemplar fragment libraries underexploit the potential of 3D character in fragment-like chemical space and that drug-like molecules in the libraries examined are predominantly 2D in character.
Figures

Structures of protein–protein interaction
inhibitors
with pronounced 3D shape in the respective protein–ligand X-ray
crystal structures: (a) (+)-JQ1, an inhibitor of bromodomain BRD4/chromatin
interactions, (b) inhibitor of LEDGF/p75 integrase
interaction, (c) Nutlin-3, an inhibitor
of Bcl2/BH3 domain interactions, and (d) ABT737, an inhibitor of MDM2/p53 interactions.
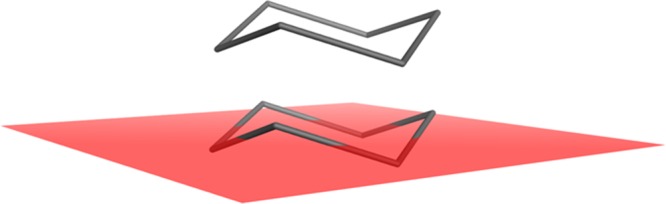
Example depiction
of plane of best fit (PBF) for cyclohexane in a chair conformation.

PMI plot for the ICRFL data set. Four evenly distributed
bins across the range of the average distance from the plane of best
fit (PBF score) are represented by the color of the points (red ≤
0.2709, 0.2709 < blue ≤ 0.5418, 0.5418 < yellow ≤
0.8128, black > 0.8128).

Scatter graph measuring the correlation between molecular globularity (MolGlob) and PBF score for the ICR fragment library data set.

Scatter graph depicting the correlation between fraction of sp3 hybridized carbons (Fsp3) and PBF score for the ICR fragment library data set.

Chemical structures and CORINA-derived
conformation comparison for molecules (1) and (2) for which Fsp3 = 0.

Chemical
structures and CORINA-derived conformation comparison for molecules
(3) (Fsp3 = 0.476) and (4) (Fsp3 = 0.474).

Example molecules
selected from the ICRFL data set (5–11) and their respective PBF scores depicted on a linear scale.

Shape comparison of molecules
(12) and (13) which score similarly according
to literature methods.

Density plot of PBF
score versus the sum of normalized principal moments of inertia (NPR) for the eMolecules data set with acyclic and Ro5 noncompliant
compounds removed. The horizontal black line represents a cutoff for
3D molecules for NPR1 + NPR2, and the vertical line, a corresponding
cutoff for PBF.

Range of PBF scores depicted as box and
whisker plots across all nine data sets. Yellow plots include all
members of the data sets, red plots are after a Lipinski Ro5 filter
has been applied.

Histogram
of PBF scores of ICR and Maybridge fragment libraries, the GDB-13
data
set, DrugBank, and ChEMBL libraries subject to RECAP algorithm, and
application of fragment-like filters.
Similar articles
-
Characterization of the Chemical Space of Known and Readily Obtainable Natural Products.J Chem Inf Model. 2018 Aug 27;58(8):1518-1532. doi: 10.1021/acs.jcim.8b00302. Epub 2018 Aug 1. J Chem Inf Model. 2018. PMID: 30010333
-
Fragment Library of Natural Products and Compound Databases for Drug Discovery.Biomolecules. 2020 Nov 6;10(11):1518. doi: 10.3390/biom10111518. Biomolecules. 2020. PMID: 33172012 Free PMC article.
-
Construction of a 3D-shaped, natural product like fragment library by fragmentation and diversification of natural products.Bioorg Med Chem. 2017 Feb 1;25(3):921-925. doi: 10.1016/j.bmc.2016.12.005. Epub 2016 Dec 8. Bioorg Med Chem. 2017. PMID: 28011199
-
Escape from planarity in fragment-based drug discovery: A physicochemical and 3D property analysis of synthetic 3D fragment libraries.Drug Discov Today Technol. 2020 Dec;38:77-90. doi: 10.1016/j.ddtec.2021.05.001. Epub 2021 Jun 17. Drug Discov Today Technol. 2020. PMID: 34895643 Review.
-
Current status and prospects of computational resources for natural product dereplication: a review.Brief Bioinform. 2016 Mar;17(2):309-21. doi: 10.1093/bib/bbv042. Epub 2015 Jul 7. Brief Bioinform. 2016. PMID: 26153512 Review.
Cited by
-
Expanding medicinal chemistry into 3D space: metallofragments as 3D scaffolds for fragment-based drug discovery.Chem Sci. 2019 Dec 12;11(5):1216-1225. doi: 10.1039/c9sc05586j. Chem Sci. 2019. PMID: 34123246 Free PMC article.
-
Exploration of piperidine 3D fragment chemical space: synthesis and 3D shape analysis of fragments derived from 20 regio- and diastereoisomers of methyl substituted pipecolinates.RSC Med Chem. 2022 Oct 11;13(12):1614-1620. doi: 10.1039/d2md00239f. eCollection 2022 Dec 14. RSC Med Chem. 2022. PMID: 36545433 Free PMC article.
-
Comprehensive analysis of commercial fragment libraries.RSC Med Chem. 2021 Dec 24;13(3):300-310. doi: 10.1039/d1md00363a. eCollection 2022 Mar 23. RSC Med Chem. 2021. PMID: 35434627 Free PMC article.
-
Green Drug Discovery: Novel Fragment Space from the Biomass-Derived Molecule Dihydrolevoglucosenone (CyreneTM).Molecules. 2023 Feb 13;28(4):1777. doi: 10.3390/molecules28041777. Molecules. 2023. PMID: 36838763 Free PMC article.
-
On the origins of three-dimensionality in drug-like molecules.Future Med Chem. 2016 Sep;8(14):1753-67. doi: 10.4155/fmc-2016-0095. Epub 2016 Aug 30. Future Med Chem. 2016. PMID: 27572621 Free PMC article.
References
-
- Reutlinger M.; Schneider G. Nonlinear dimensionality reduction and mapping of compound libraries for drug discovery. J. Mol. Graphics Modell. 2012, 34, 108–117and references therein. - PubMed
-
- Clemons P. A.; Wilson J. A.; Dančík V.; Muller S.; Carrinski H. A.; Wagner B. K.; Koehler A. N.; Schreiber S. L. Quantifying structure and performance diversity for sets of small molecules comprising small-molecule screening collections. Proc.Natl. Acad. Sci. USA 2011, 108(17), 6817–6822. - PMC - PubMed
-
- Djuric S. W.; Akritopoulou-Zanze I.; Cox P. B.; Galasinski S. Compound collection enhancement and paradigms for high-throughput screening-an update. Annu. Rep. Med. Chem. 2010, 45, 409–428.
-
- Grant J. A.; Gallardo M. A.; Pickup B. T. A fast method of molecular shape comparison: A simple application of a Gaussian description of molecular shape. J. Comput. Chem. 1996, 17, 1653.
Publication types
MeSH terms
Substances
Grants and funding
LinkOut - more resources
Full Text Sources
Molecular Biology Databases
