Review
. 2012 Oct;2(10):881-98.
doi: 10.1158/2159-8290.CD-12-0345. Epub 2012 Sep 25.

Cancer cell metabolism: one hallmark, many faces

Affiliations
Review

Cancer cell metabolism: one hallmark, many faces

Jason R Cantor et al. Cancer Discov. 2012 Oct.

Abstract

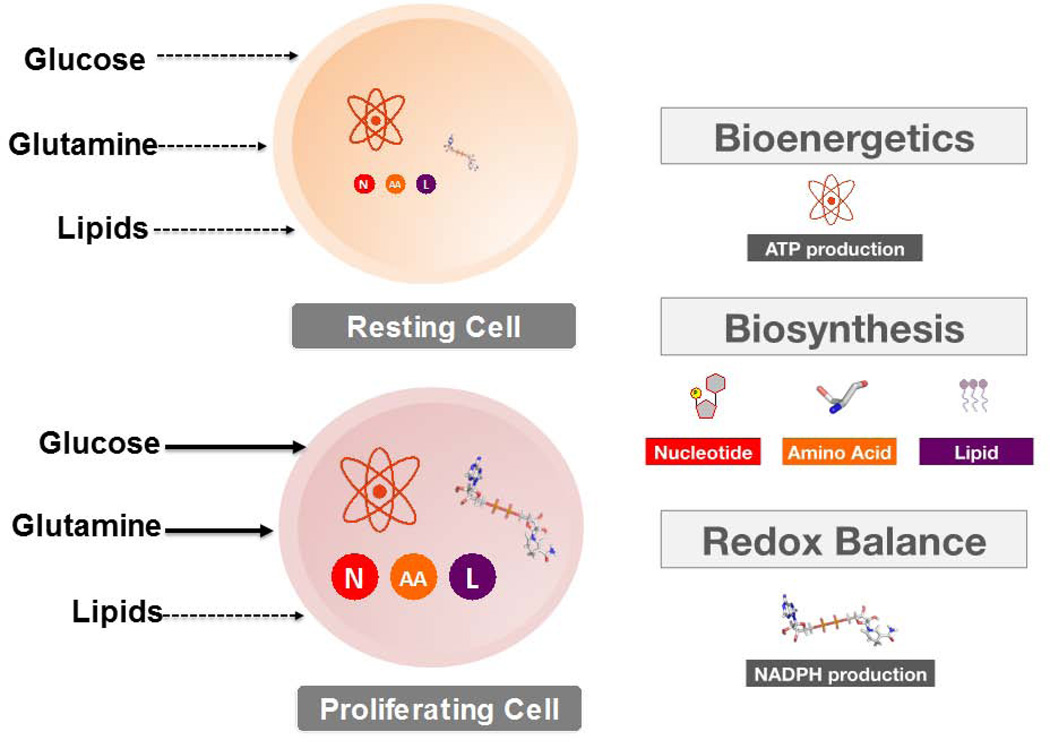
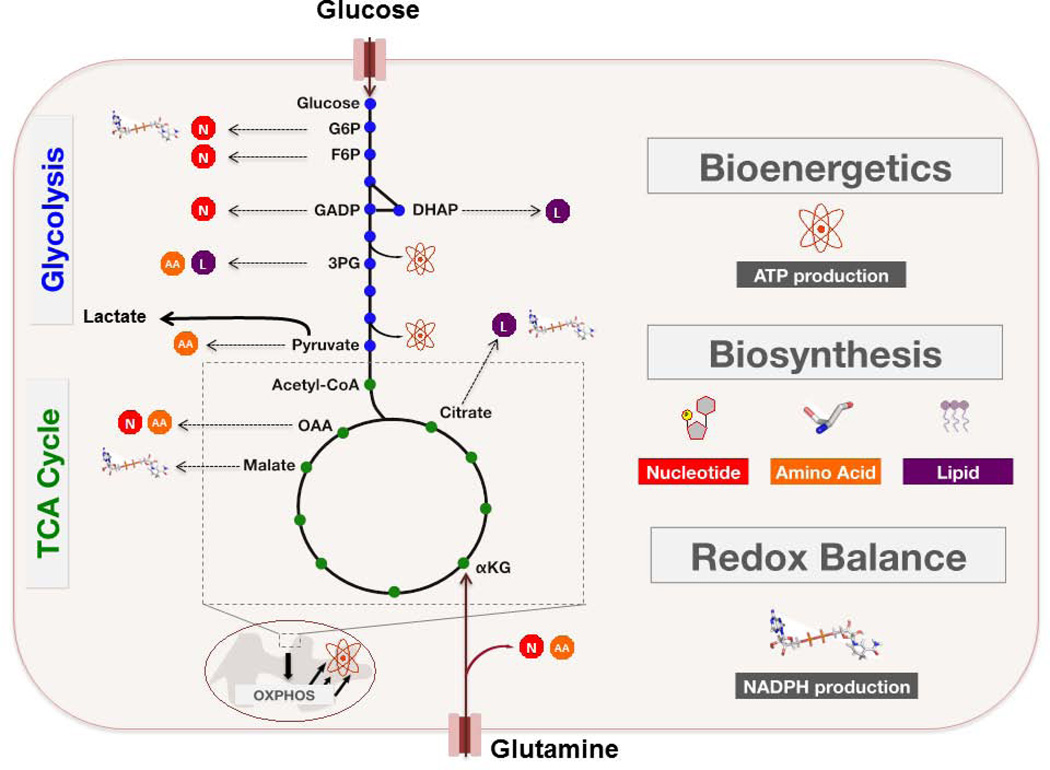
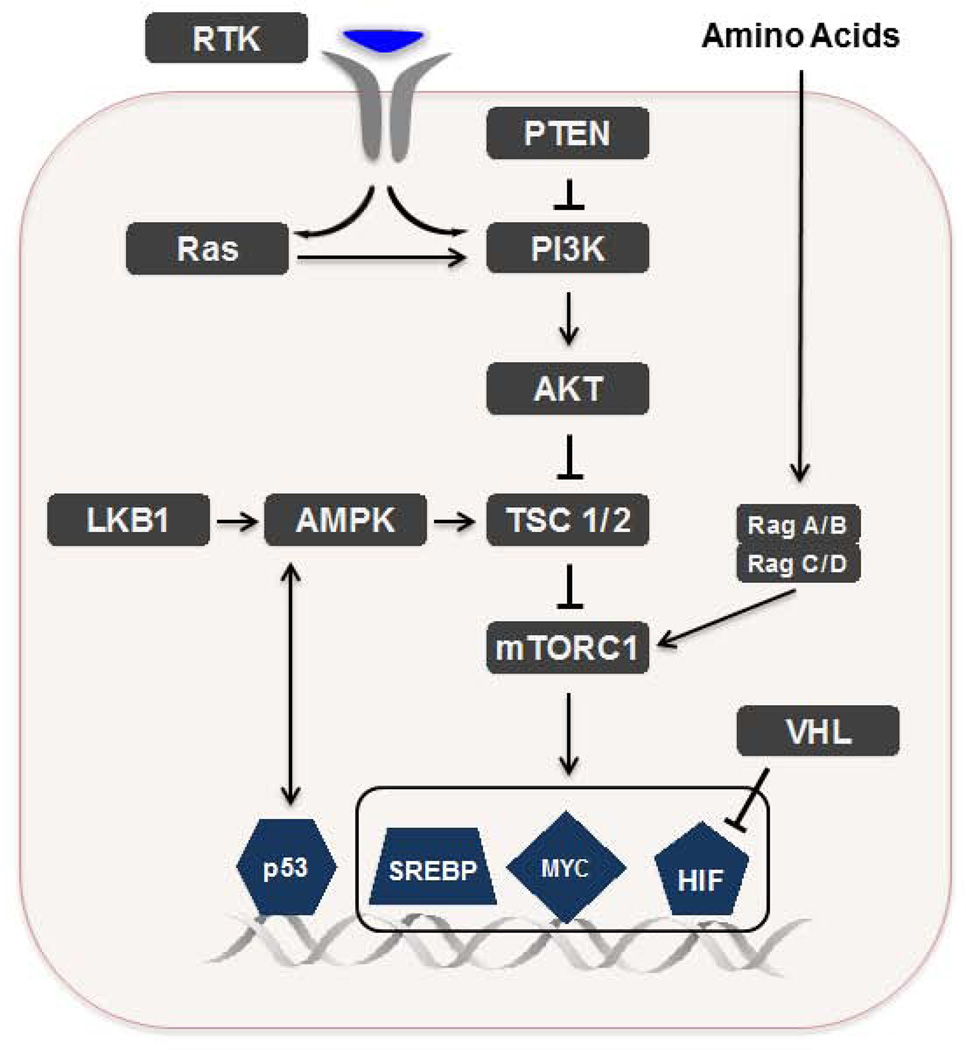
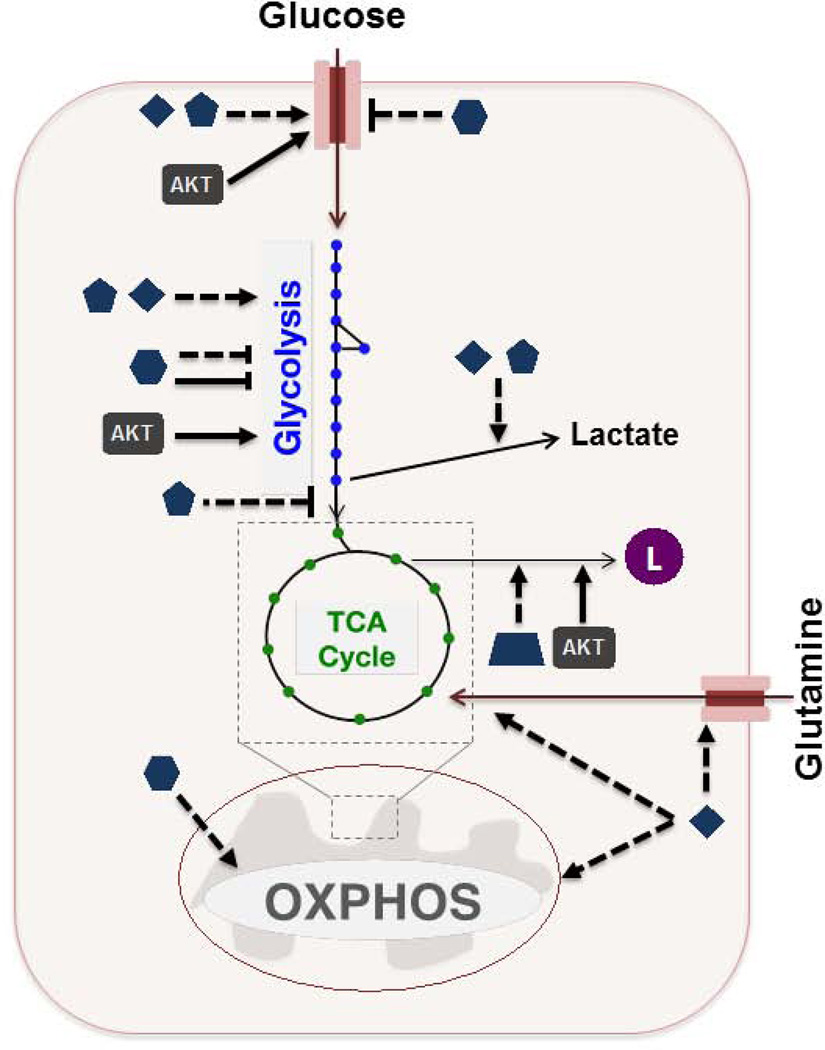
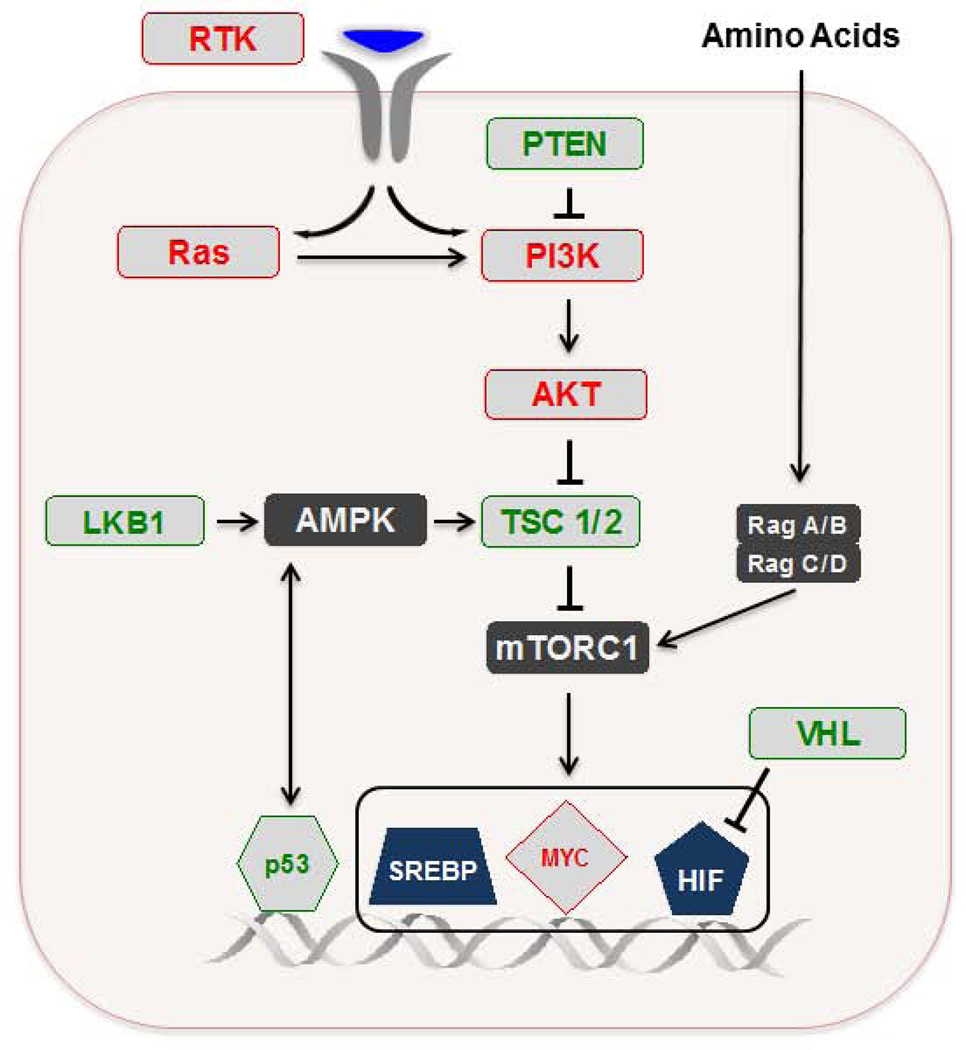
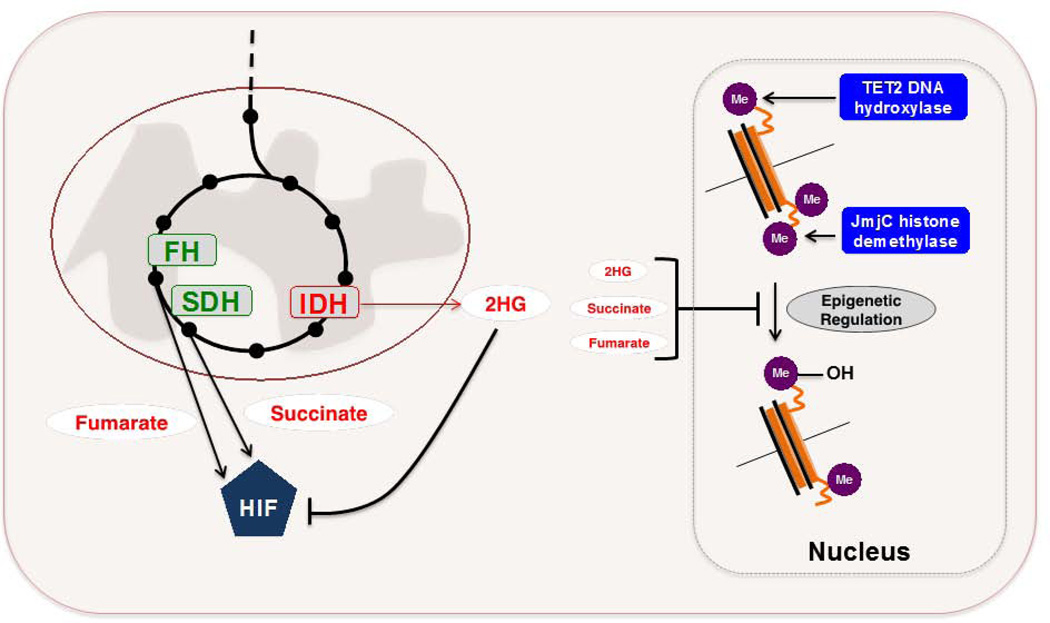
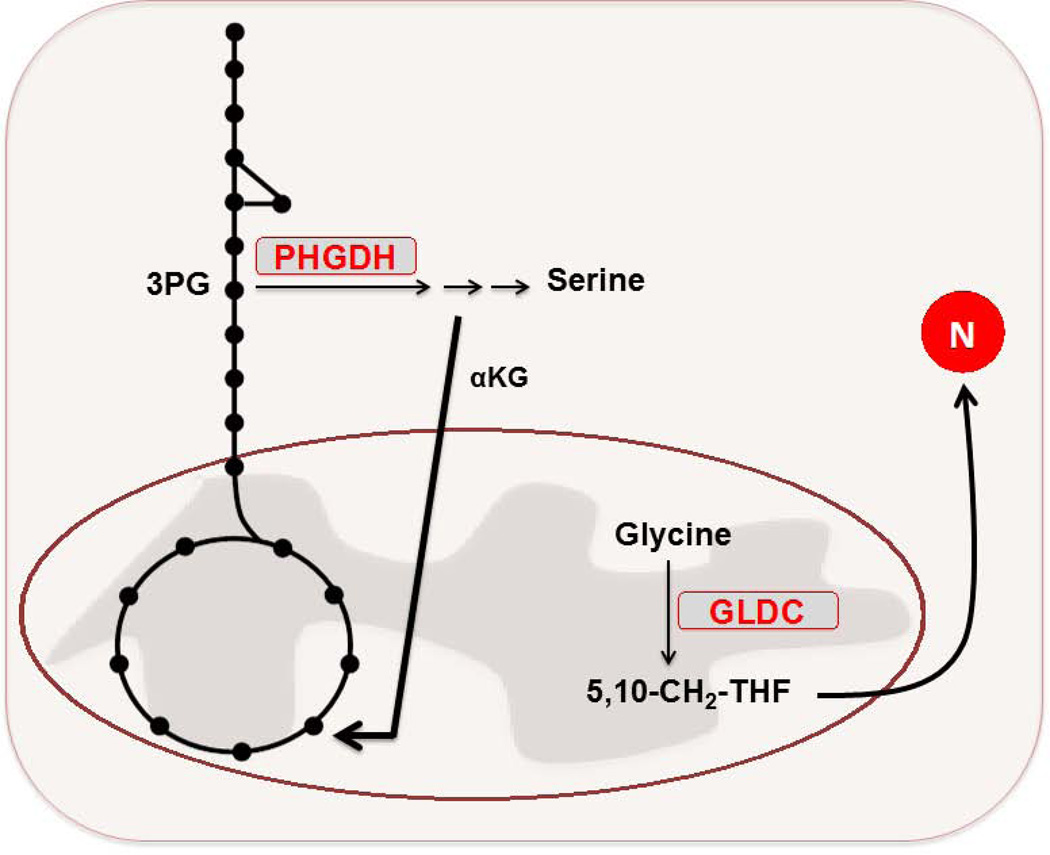
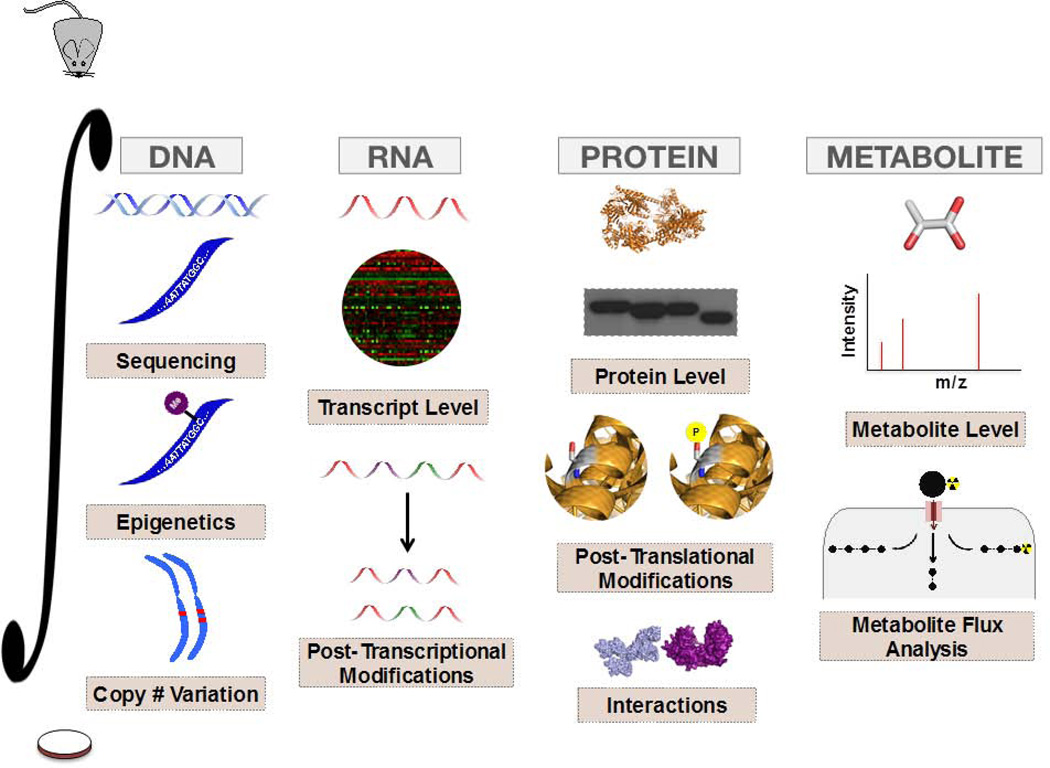
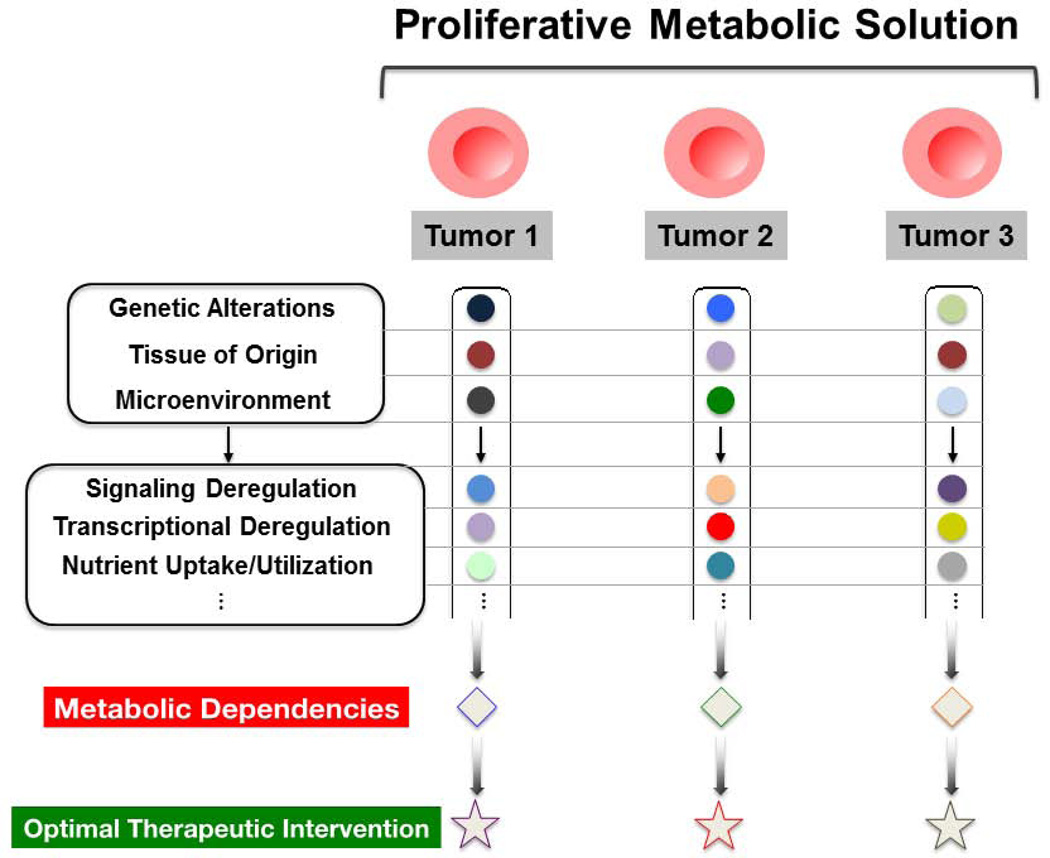
Cancer cells must rewire cellular metabolism to satisfy the demands of growth and proliferation. Although many of the metabolic alterations are largely similar to those in normal proliferating cells, they are aberrantly driven in cancer by a combination of genetic lesions and nongenetic factors such as the tumor microenvironment. However, a single model of altered tumor metabolism does not describe the sum of metabolic changes that can support cell growth. Instead, the diversity of such changes within the metabolic program of a cancer cell can dictate by what means proliferative rewiring is driven, and can also impart heterogeneity in the metabolic dependencies of the cell. A better understanding of this heterogeneity may enable the development and optimization of therapeutic strategies that target tumor metabolism.


Conflict of interest statement

The authors disclose no potential conflicts of interest.

Figures

FIGURE 1
FIGURE 1. Metabolism: Resting versus Proliferating cells
Normal resting cells employ a catabolic metabolism to satisfy the energetic requirements of homeostasis. This demand is met through fatty acid oxidation and the oxidative metabolism of glucose. Proliferating cells however, must rewire their metabolic program to not only meet various energetic requirements, but to also satisfy the anabolic demands of macromolecular biosynthesis (nucleotides, lipids, proteins), as well as the maintenance of redox homeostasis. Upon growth factor-mediated stimulation, proliferating cells increase their uptake of glucose and glutamine, which are the two primary substrates that fuel cell growth. Solid arrows are indicative of increased cellular uptake.
FIGURE 2
FIGURE 2. Glucose and Glutamine Fuel Proliferation
Proliferating cells must satisfy three metabolic demands: (i) bioenergetics, (ii) macromolecular biosynthesis, and (iii) redox maintenance. The metabolic program of these cells is marked by an increased uptake of glucose and glutamine, and subsequent utilization of these two substrates to support cell growth. Most imported glucose is metabolized to lactate through aerobic glycolysis, although this process is a far less efficient means of ATP production relative to oxidative metabolism. However, the preferential catabolism of glucose to lactate allows proliferating cells to shunt various glycolytic intermediates (blue dots) into branching anabolic pathways that support additional metabolic requirements. Glutamine serves as a nitrogen source for the biosynthesis of nucleotides and various non-essential amino acids. In addition, glutamine is an important carbon source for the replenishment of TCA cycle intermediates (green dots), which are diverted into various anabolic pathways during proliferation. Further detail is found in the main body of the text. G6P – glucose-6-phosphate. F6P – fructose-6-phosphate. GADP – glyceraldehyde-3-phosphate. DHAP – dihydroxyacetone phosphate. 3PG – 3-phosphoglycerate. αKG – α – ketoglutarate. OAA – oxaloacetate. N – nucleotide biosynthesis. L – lipid biosynthesis. AA – amino acid biosynthesis.
FIGURE 3
FIGURE 3. Signaling and transcriptional machinery that regulate metabolism
A. The PI3K/Akt axis can be activated downstream of RTK activation or as a downstream effector of activated Ras. PTEN is a negative regulator of the PI3K/Akt pathway. mTORC1 can become activated upon Akt-mediated phosphorylation of either of two mTORC1 inhibitors: TSC2 (part of the TSC1-TSC2 complex) or PRAS40. Conversely, mTORC1 activity can be suppressed through AMPK-mediated phosphorylation of either TSC2 or RAPTOR. Finally, amino acids can activate mTORC1 by modulating the nucleotide loading states of Rag GTPases, which form obligate heterodimers consisting of RagA or RagB with Rag C or Rag D. Further description of amino acid-dependent activation of mTORC1 and the additional molecular components of this pathway are reviewed elsewhere (41). AMPK itself is activated by the upstream kinase LKB1. Among the downstream targets of mTORC1-dependent translation are the transcription factors HIF-1, Myc, and SREBP-1. HIF-1 stabilization is repressed by VHL under normoxic conditions. p53 also has a multifaceted role in metabolic control, which includes involvement in a positive feedback loop with AMPK. RTK – receptor tyrosine kinase. PTEN – phosphatase and tensin homolog. PI3K – phosphatidylinositol-3-phosphate kinase. LKB1 – liver kinase B1. AMPK – AMP-activated protein kinase. TSC – tuberous sclerosis complex. mTOR – mechanistic target of rapamycin. VHL – von Hippel-Lindau. SREBP – sterol regulatory element-binding protein. HIF – hypoxia-inducible factor. B. HIF induces the expression of various glucose transporters and glycolytic enzymes, and promotes the flux of pyruvate to lactate. Myc affects glucose metabolism in a similar manner to HIF. Additionally, Myc stimulates the expression of glutamine transporters, and promotes mitochondrial biogenesis and entry of glutamine carbon into the TCA cycle. SREBP-1 induces the expression of several genes involved in fatty acid synthesis. p53 affects glucose metabolism through repression of glucose transporters and glycolytic activity, while also transcriptionally promoting oxidative phosphorylation. Akt promotes membrane translocation of glucose transporters and the activation of various glycolytic and fatty acid synthesis enzymes. Dashed arrow: transcription-mediated effect C. Various components of the signaling and transcriptional network can genetically behave as oncogenes (red) or tumor suppressors (green) which enable deregulation of the metabolic regulation depicted in (B).
FIGURE 4
FIGURE 4. Metabolic enzymes as oncogenes or tumor suppressors
A. SDH and FH can genetically behave as tumor suppressors in specific cancers. The accumulation of succinate or fumarate that arises owing to inactivating mutations in SDH or FH potentiates aberrant stabilization of HIF1 through competitive inhibition of PHDs. IDH mutants arise in a fraction of gliomas, acute myeloid leukemias, and chondrosarcomas. These mutants acquire a neomorphic enzymatic activity that enables the conversion of αKG to 2HG, which can impair normal epigenetic regulation through competitive inhibition of various αKG-dependent dioxygenases, including TET2 DNA hydroxylases and JmjC histone demethylases. Recent evidence suggests that 2HG can also promote HIF1 degradation, and that both succinate and fumarate accumulation may also inhibit various αKG-dependent dioxygenases. Further investigation into the pathophysiological role of 2HG may reveal a context-dependence to its functional role. SDH – succinate dehydrogenase. FH – fumarate hydratase. HIF – hypoxia-inducible factor. PHD – prolyl hydroxylase. αKG – α – ketoglutarate. 2HG – 2-hydroxyglutarate. B. PHGDH is elevated in a fraction of malignant breast and melanoma cells. This elevation promotes flux of glucose into the serine biosynthesis pathway. Suppression of PHGDH in those cell lines that had elevated expression of the enzyme caused a strong decrease in cell proliferation and serine synthesis. Moreover, it was revealed that the serine pathway was responsible for nearly 50% of the net conversion of glutamate to αKG for glutamine-driven anaplerosis in these PHGDH-overexpressing cells. GLDC is overexpressed in the TIC population of NSCLC cells. Suppression of GLDC effectively reduced proliferation in the TICs. Among the alterations driven by enhanced GLDC expression in these cells was an increase in pyrimidine biosynthesis, which made these cells particularly sensitive to treatment with low doses of the antimetabolite methotrexate. PHGDH – 3-phosphoglycerate dehydrogenase. GLDC – glycine decarboxylase. NSCLC – non-small cell lung cancer. TIC – tumor-initiating cell.
Figure 5
Figure 5. Application and Integration of Tools to study Tumor Metabolism
The exploitation and integration of various components of the omics cascade can provide a new depth of insight into the study of tumor metabolism. Moreover, these approaches can be employed not only for the interrogation of cell lines in culture, but can also be incorporated with in vivo systems used to better model human metabolism.
Figure 6
Figure 6. Unraveling Metabolic Diversity
The commonality of metabolic rewiring in tumor cells is that the sum of alterations and adaptations must ultimately provide a means to support the various demands of cell proliferation. However, the proliferative solution arises in an integrated response to some combination of genetic and non-genetic determinants, which in turn, dictate the precise metabolic signature and dependencies of a given tumor cell. A better understanding of this heterogeneity should promote the continued development of therapeutic strategies that best exploit metabolic liabilities while achieving maximal therapeutic windows.

References

    1. Greaves M, Maley CC. Clonal evolution in cancer. Nature. 2012;481:306–313. - PMC - PubMed
    1. Siegel R, Naishadham D, Jemal A. Cancer statistics, 2012. CA Cancer J Clin. 2012;62:10–29. - PubMed
    1. Kelloff GJ, Sigman CC. Cancer biomarkers: selecting the right drug for the right patient. Nat Rev Drug Discov. 2012;11:1–14. - PubMed
    1. Wong KM, Hudson TJ, McPherson JD. Unraveling the Genetics of Cancer: Genome Sequencing and Beyond. Annu Rev Genomics Hum Genet. 2011;12:407–430. - PubMed
    1. Gerlinger M, Rowan AJ, Horswell S, Larkin J, Endesfelder D, Gronroos E, et al. Intratumor heterogeneity and branched evolution revealed by multiregion sequencing. N Engl J Med. 2012;366:883–892. - PMC - PubMed

Publication types