

Basal but not luminal mammary epithelial cells require PI3K/mTOR signaling for Ras-driven overgrowth
- PMID: 23010075
- PMCID: PMC4078248
- DOI: 10.1158/0008-5472.CAN-12-1635
Basal but not luminal mammary epithelial cells require PI3K/mTOR signaling for Ras-driven overgrowth
Abstract
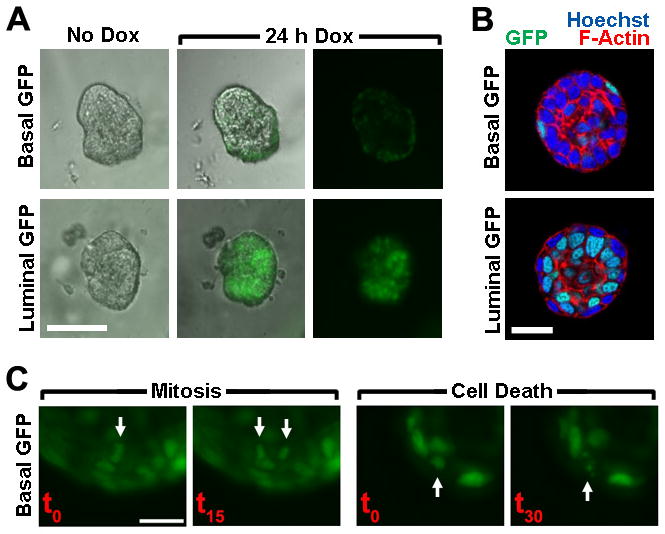
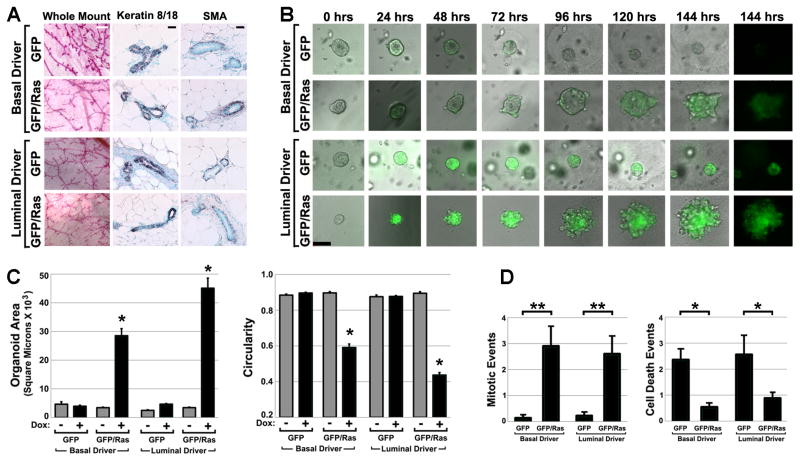
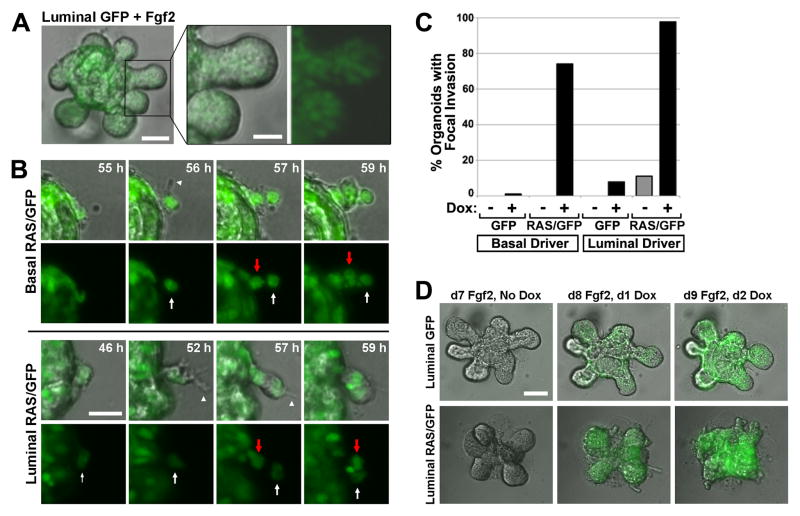
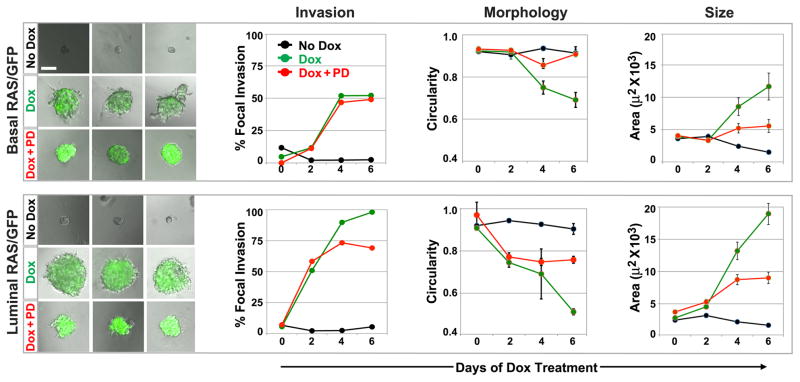
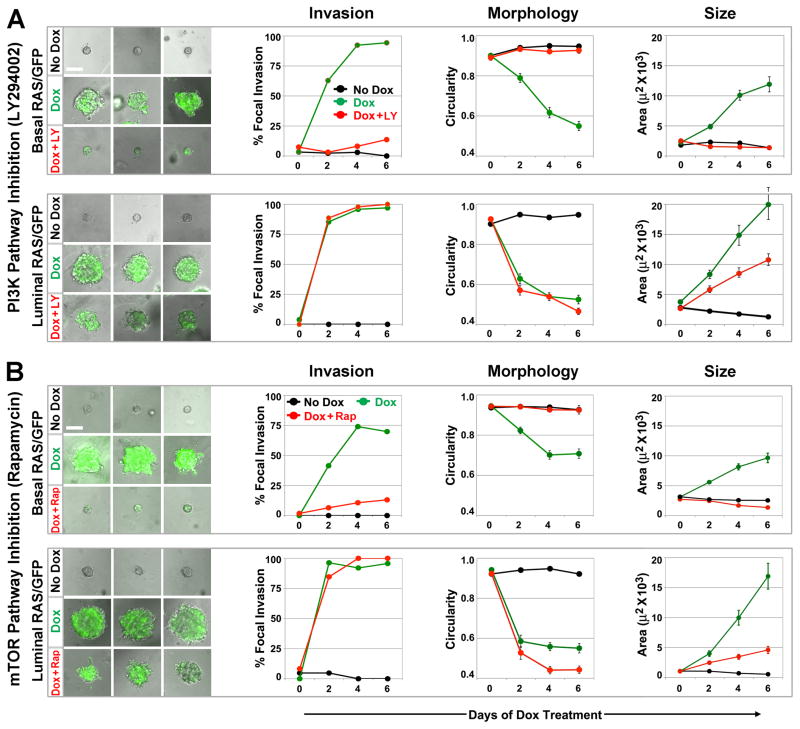
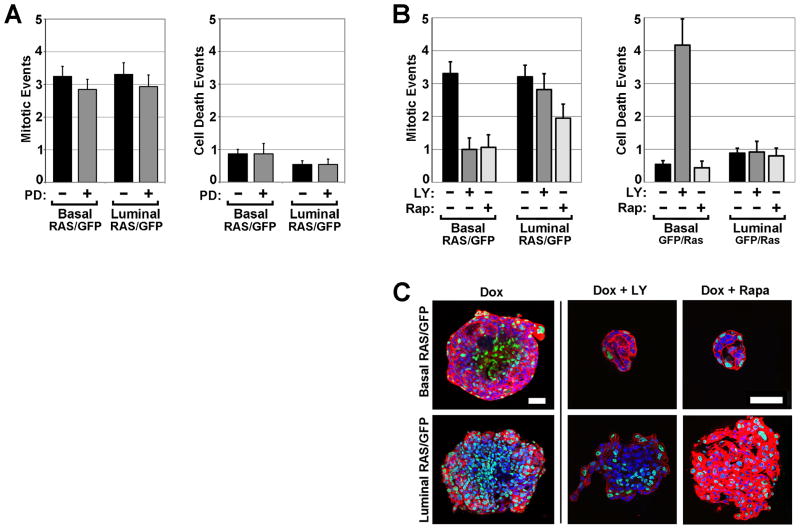
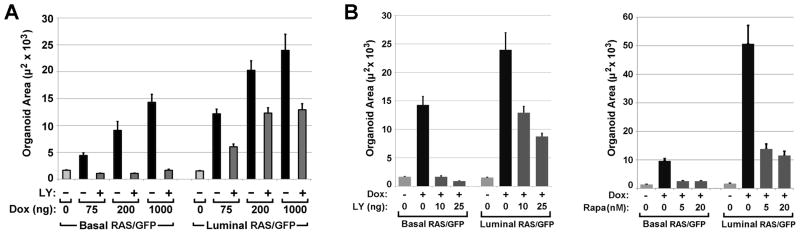
The mammary ducts of humans and mice are comprised of two main mammary epithelial cell (MEC) subtypes: a surrounding layer of basal MECs and an inner layer of luminal MECs. Breast cancer subtypes show divergent clinical behavior that may reflect properties inherent in their MEC compartment of origin. How the response to a cancer-initiating genetic event is shaped by MEC subtype remains largely unexplored. Using the mouse mammary gland, we designed organotypic three-dimensional culture models that permit challenge of discrete MEC compartments with the same oncogenic insult. Mammary organoids were prepared from mice engineered for compartment-restricted coexpression of oncogenic H-RAS(G12V) together with a nuclear fluorescent reporter. Monitoring of H-RAS(G12V)-expressing MECs during extended live cell imaging permitted visualization of Ras-driven phenotypes via video microscopy. Challenging either basal or luminal MECs with H-RAS(G12V) drove MEC proliferation and survival, culminating in aberrant organoid overgrowth. In each compartment, Ras activation triggered modes of collective MEC migration and invasion that contrasted with physiologic modes used during growth factor-initiated branching morphogenesis. Although basal and luminal Ras activation produced similar overgrowth phenotypes, inhibitor studies revealed divergent use of Ras effector pathways. Blocking either the phosphoinositide 3-kinase or the mammalian target of rapamycin pathway completely suppressed Ras-driven invasion and overgrowth of basal MECs, but only modestly attenuated Ras-driven phenotypes in luminal MECs. We show that MEC subtype defines signaling pathway dependencies downstream of Ras. Thus, cells-of-origin may critically determine the drug sensitivity profiles of mammary neoplasia.
©2012 AACR.
Conflict of interest statement
Figures
Similar articles
-
Synergistic inhibition of ovarian cancer cell growth by combining selective PI3K/mTOR and RAS/ERK pathway inhibitors.Eur J Cancer. 2013 Dec;49(18):3936-44. doi: 10.1016/j.ejca.2013.08.007. Epub 2013 Sep 3. Eur J Cancer. 2013. PMID: 24011934
-
The mitogen-activated protein kinase pathway tonically inhibits both basal and IGF-I-stimulated IGF-binding protein-5 production in mammary epithelial cells.J Endocrinol. 2007 Aug;194(2):349-59. doi: 10.1677/JOE-06-0121. J Endocrinol. 2007. PMID: 17641284
-
New insights into lineage restriction of mammary gland epithelium using parity-identified mammary epithelial cells.Breast Cancer Res. 2014 Jan 7;16(1):R1. doi: 10.1186/bcr3593. Breast Cancer Res. 2014. PMID: 24398145 Free PMC article.
-
The myoepithelial cell: its role in normal mammary glands and breast cancer.Folia Morphol (Warsz). 2010 Feb;69(1):1-14. Folia Morphol (Warsz). 2010. PMID: 20235044 Review.
-
Culture Models to Investigate Mechanisms of Milk Production and Blood-Milk Barrier in Mammary Epithelial Cells: a Review and a Protocol.J Mammary Gland Biol Neoplasia. 2023 May 1;28(1):8. doi: 10.1007/s10911-023-09536-y. J Mammary Gland Biol Neoplasia. 2023. PMID: 37126158 Free PMC article. Review.
Cited by
-
A Multistage Murine Breast Cancer Model Reveals Long-Lived Premalignant Clones Refractory to Parity-Induced Protection.Cancer Prev Res (Phila). 2020 Feb;13(2):173-184. doi: 10.1158/1940-6207.CAPR-19-0322. Epub 2019 Nov 7. Cancer Prev Res (Phila). 2020. PMID: 31699706 Free PMC article.
-
Breast Cancer: A Molecularly Heterogenous Disease Needing Subtype-Specific Treatments.Med Sci (Basel). 2020 Mar 23;8(1):18. doi: 10.3390/medsci8010018. Med Sci (Basel). 2020. PMID: 32210163 Free PMC article. Review.
-
Synthetic lethality by targeting the RUVBL1/2-TTT complex in mTORC1-hyperactive cancer cells.Sci Adv. 2020 Jul 31;6(31):eaay9131. doi: 10.1126/sciadv.aay9131. eCollection 2020 Jul. Sci Adv. 2020. PMID: 32789167 Free PMC article.
-
Three-dimensional organotypic culture: experimental models of mammalian biology and disease.Nat Rev Mol Cell Biol. 2014 Oct;15(10):647-64. doi: 10.1038/nrm3873. Epub 2014 Sep 17. Nat Rev Mol Cell Biol. 2014. PMID: 25237826 Free PMC article. Review.
-
NF-κB2 signalling in enteroids modulates enterocyte responses to secreted factors from bone marrow-derived dendritic cells.Cell Death Dis. 2019 Nov 26;10(12):896. doi: 10.1038/s41419-019-2129-5. Cell Death Dis. 2019. PMID: 31772152 Free PMC article.
References
-
- Shackleton M, Vaillant F, Simpson KJ, Stingl J, Smyth GK, Asselin-Labat ML, et al. Generation of a functional mammary gland from a single stem cell. Nature. 2006;439:84–88. - PubMed
-
- Stingl J, Eirew P, Ricketson I, Shackleton M, Vaillant F, Choi D, et al. Purification and unique properties of mammary epithelial stem cells. Nature. 2006;439:993–997. - PubMed
-
- Van Keymeulen A, Rocha AS, Ousset M, Beck B, Bouvencourt G, Rock J, et al. Distinct stem cells contribute to mammary gland development and maintenance. Nature. 2011;479:189–193. - PubMed
-
- Visvader JE. Cells of origin in cancer. Nature. 2011;469:314–322. - PubMed
Publication types
MeSH terms
Substances
Grants and funding
LinkOut - more resources
Full Text Sources
Molecular Biology Databases
Miscellaneous
