. 2013 Mar:56:193-203.
doi: 10.1016/j.freeradbiomed.2012.09.020. Epub 2012 Sep 23.

Mitochondrial handling of excess Ca2+ is substrate-dependent with implications for reactive oxygen species generation

Affiliations

Mitochondrial handling of excess Ca2+ is substrate-dependent with implications for reactive oxygen species generation

Mohammed Aldakkak et al. Free Radic Biol Med. 2013 Mar.

Abstract

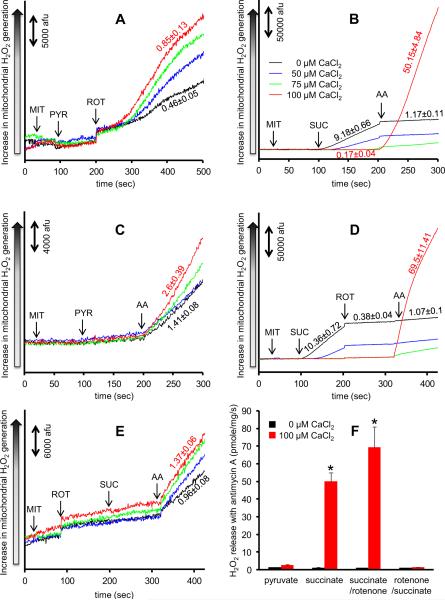
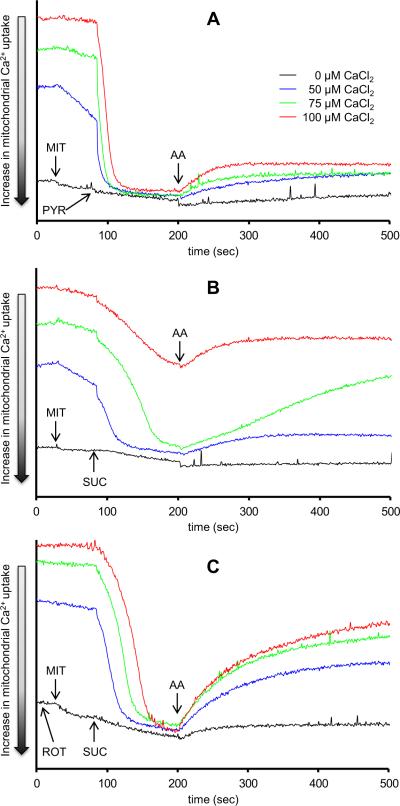
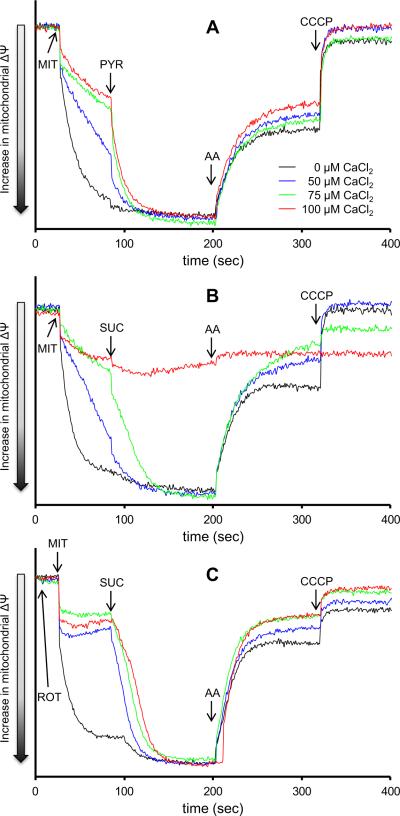
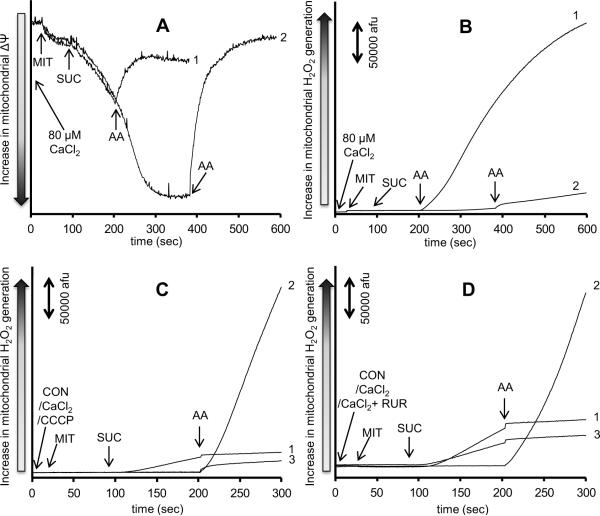
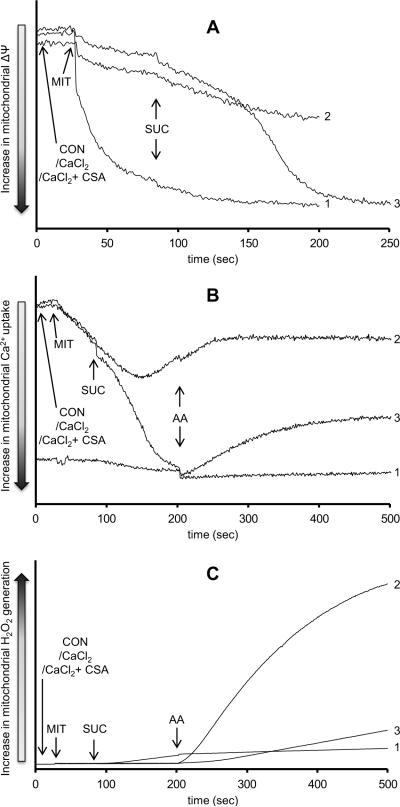
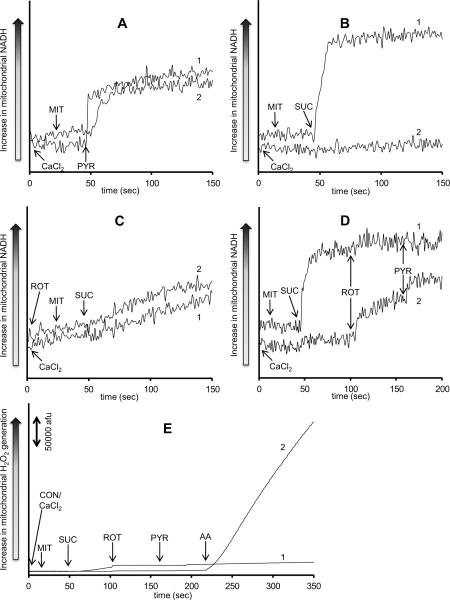
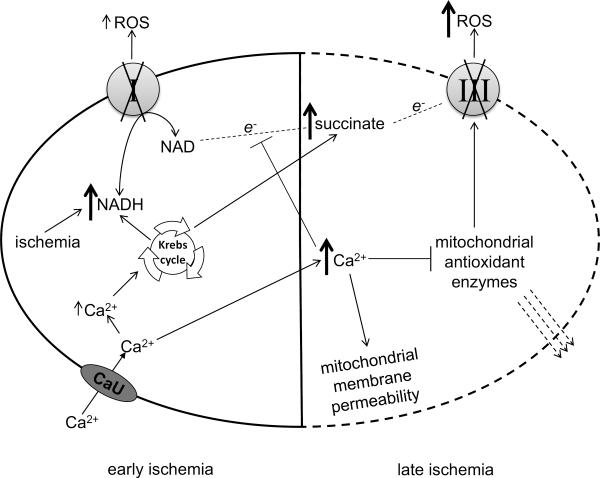
The mitochondrial electron transport chain is the major source of reactive oxygen species (ROS) during cardiac ischemia. Several mechanisms modulate ROS production; one is mitochondrial Ca(2+) uptake. Here we sought to elucidate the effects of extramitochondrial Ca(2+) (e[Ca(2+)]) on ROS production (measured as H(2)O(2) release) from complexes I and III. Mitochondria isolated from guinea pig hearts were preincubated with increasing concentrations of CaCl(2) and then energized with the complex I substrate Na(+) pyruvate or the complex II substrate Na(+) succinate. Mitochondrial H(2)O(2) release rates were assessed after giving either rotenone or antimycin A to inhibit complex I or III, respectively. After pyruvate, mitochondria maintained a fully polarized membrane potential (ΔΨ; assessed using rhodamine 123) and were able to generate NADH (assessed using autofluorescence) even with excess e[Ca(2+)] (assessed using CaGreen-5N), whereas they remained partially depolarized and did not generate NADH after succinate. This partial ΔΨ depolarization with succinate was accompanied by a large release in H(2)O(2) (assessed using Amplex red/horseradish peroxidase) with later addition of antimycin A. In the presence of excess e[Ca(2+)], adding cyclosporin A to inhibit mitochondrial permeability transition pore opening restored ΔΨ and significantly decreased antimycin A-induced H(2)O(2) release. Succinate accumulates during ischemia to become the major substrate utilized by cardiac mitochondria. The inability of mitochondria to maintain a fully polarized ΔΨ under excess e[Ca(2+)] when succinate, but not pyruvate, is the substrate may indicate a permeabilization of the mitochondrial membrane, which enhances H(2)O(2) emission from complex III during ischemia.


Figures

Fig. 1
Fig. 1. Time dependent changes in H2O2 release rates in isolated mitochondria assessed using amplex red with horseradish peroxidase
Panel A shows H2O2 levels from inhibited complex I in pyruvate-energized mitochondria. Panel B shows H2O2 levels from complex I due to reversed electron transfer and from inhibited complex III in succinate-energized mitochondria. Panel C shows H2O2 levels from inhibited complex III in pyruvate-energized mitochondria. Panel D shows H2O2 levels from inhibited complex III in succinate-energized mitochondria but with rotenone added after succinate to prevent reverse electron transfer. Panel E shows H2O2 levels from inhibited complex III in succinate-energized mitochondria but with rotenone added before succinate to prevent reverse electron transfer. CaCl2 was added before any other additions at time 0. Numbers indicate mean values ± (SEM) of pmole H2O2 emission/mg/s. The number of animals used ranged between 6–8 per group. Panel F shows a summary of the effects of added CaCl2 on rates of H2O2 release under the four conditions (pyruvate, succinate, succinate first followed by rotenone, or rotenone first followed by succinate) with antimycin A. Columns represent mean values ± (SEM) of pmole H2O2 emission/mg/s. * indicates significant change in H2O2 release rate from inhibited complex III under high e[Ca2+] in succinate or succinate/rotenone vs. pyruvate or rotenone/succinate-energized mitochondria. Abbreviations: MIT, mitochondria (0.5 mg/ml); PYR, pyruvate (10 mM); SUC, succinate (10 mM); ROT, rotenone (10 μM); AA, antimycin A (5 μM).
Fig. 2
Fig. 2. Time dependent changes in extra-mitochondrial Ca2+ assessed using CaGreen-5N
Isolated mitochondria were energized with pyruvate (Panel A), succinate (Panel B), or succinate in the presence of rotenone (Panel C). Rotenone was added to the mitochondrial suspension at time 0. Mitochondria were pre-incubated with increasing [CaCl2]. The number of animals used ranged between 6–8 per group. All figures have the same scale. Abbreviations: MIT, mitochondria (0.5 mg/ml); PYR, pyruvate (10 mM); SUC, succinate (10 mM); ROT, rotenone (10 μM); AA, antimycin A (5 μM).
Fig. 3
Fig. 3. Time dependent changes in mitochondrial inner membrane potential assessed using rhodamine 123
Isolated mitochondria were energized with pyruvate (Panel A), succinate (Panel B), or succinate in the presence of rotenone (Panel C). Rotenone was added to the mitochondrial suspension at time 0. Mitochondria were pre-incubated with increasing [CaCl2]. The number of animals used ranged between 6–8 per group. All figures have the same scale. Abbreviations: MIT, mitochondria (0.5 mg/ml); PYR, pyruvate (10 mM); SUC, succinate (10 mM); ROT, rotenone (10 μM); AA, antimycin A (5 μM); CCCP, carbonyl cyanide-m-chlorophenylhydrazenone (4μM).
Fig. 4
Fig. 4. Effect of membrane potential and extra-mitochondrial Ca2+ on H2O2 release due to complex III inhibition
Time dependent changes in mitochondrial inner membrane potential assessed using rhodamine 123 (Panel A) and H2O2 generation assessed using amplex red with horseradish peroxidase (Panel B) in succinate-energized mitochondria. Mitochondria were pre-incubated with 80 μM CaCl2. Antimycin A was added at 200 s in Trace 1 and at 400 s in Trace 2. Panels C and D show time dependent changes in H2O2 levels in succinate-energized mitochondria. In Panel C, mitochondria were not pre-incubated (Trace 1), pre-incubated with 100 μM CaCl2 (Trace 2), or pre-incubated with 4 μM CCCP (Trace 3). In Panel D, mitochondria were not incubated (Trace 1), pre-incubated with 100 μM CaCl2 (Trace 2), or pre-incubated with 100 μM CaCl2 + 25 μM ruthenium red (Trace 3). The number of animals was 3 per group. Abbreviations: MIT, mitochondria (0.5 mg/ml); CON, control (H2O); CCCP, carbonyl cyanide-m-chlorophenylhydrazenone (4μM); RUR, ruthenium red (25 μM); SUC, succinate (10 mM); AA, antimycin A (5 μM).
Fig. 5
Fig. 5. Role of mitochondrial permeability transition pore in H2O2 release due to complex III inhibition
Time dependent changes in mitochondrial inner membrane potential (Panel A), extra-mitochondrial Ca2+ (Panel B), and H2O2 levels (Panel C) in succinate-energized mitochondria. In all panels, mitochondria were either not pre-incubated (Trace 1), pre-incubated with 100 μM CaCl2 (Trace 2), or pre-incubated with 100 μM CaCl2 + 0.5 μM cyclosporine A (Trace 3). The number of animals was 3 per group. Abbreviations: MIT, mitochondria (0.5 mg/ml); CON, control (H2O); CSA, cyclosporine A (0.5 μM); SUC, succinate (10 mM); AA, antimycin A (5 μM).
Fig. 6
Fig. 6. Time dependent changes in NADH assessed using autofluorescence
Isolated mitochondria were energized with pyruvate (Panel A), succinate (Panel B), or succinate in the presence of rotenone (Panel C). Rotenone was added to the mitochondrial suspension at time 0. In a modified protocol, isolated mitochondria were energized with succinate, and then rotenone was added followed by pyruvate (Panel D). A similar protocol was used but with the addition of antimycin A after all other additions and in the presence of amplex red to measure H2O2 (Panel E). Mitochondria were pre-incubated with either 0 μM CaCl2 (Trace 1) or with 100 μM CaCl2 (Trace 2). The number of animals ranged between 6–8 per group. All NADH figures have the same scale. Abbreviations: MIT, mitochondria (0.5 mg/ml); CON, control (H2O); PYR, pyruvate (10 mM); SUC, succinate (10 mM); ROT, rotenone (10 μM); AA, antimycin A (5 μM).
Fig. 7
Fig. 7. Proposed role for complexes I and III in ROS generation as ischemia progresses
Early ischemia impairs electron flow through ETC and causes a sudden increase in NADH [–9], and a mild gradual increase in Ca2+ [–9] and impairs complex I activity [13]. The increase in Ca2+ may increase NADH via the Krebs cycle and stimulate respiration (Table 1). More NADH leads to more electron flow through the impaired complex I and thus a mild increase in ROS [–10]. Late ischemia causes a large increase in Ca2+ [–9], accumulation of succinate [18, 19], and impaired complex III activity [13]. Excess Ca2+ causes mitochondrial membrane permeability [52, 67], Δψ depolarization which prevents reversed electron flow to complex I [38, 45] and the subsequent generation of NADH (Fig. 6B), and direct inhibition of the antioxidant systems [63]. Furthermore, the antioxidant enzymes may be lost due to increased membrane permeability [62]. This enhances ROS emission due to complex III impairment during late ischemia.

References

    1. Stowe DF, Camara AK. Mitochondrial reactive oxygen species production in excitable cells: modulators of mitochondrial and cell function. Antioxid Redox Signal. 2009;11:1373–1414. - PMC - PubMed
    1. Tsutsui H, Kinugawa S, Matsushima S. Oxidative stress and mitochondrial DNA damage in heart failure. Circ J. 2008;72(Suppl A):A31–37. - PubMed
    1. Stone D, Darley-Usmar V, Smith DR, O'Leary V. Hypoxia-reoxygenation induced increase in cellular Ca2+ in myocytes and perfused hearts: the role of mitochondria. J Mol Cell Cardiol. 1989;21:963–973. - PubMed
    1. Crompton M. The mitochondrial permeability transition pore and its role in cell death. Biochem J. 1999;341(Pt 2):233–249. - PMC - PubMed
    1. Halestrap AP, Clarke SJ, Javadov SA. Mitochondrial permeability transition pore opening during myocardial reperfusion--a target for cardioprotection. Cardiovasc Res. 2004;61:372–385. - PubMed

Publication types

LinkOut - more resources