. 2012 Nov 21;12(22):4835-47.
doi: 10.1039/c2lc21006a.

Studies of bacterial aerotaxis in a microfluidic device

Affiliations

Studies of bacterial aerotaxis in a microfluidic device

Micha Adler et al. Lab Chip. .

Abstract

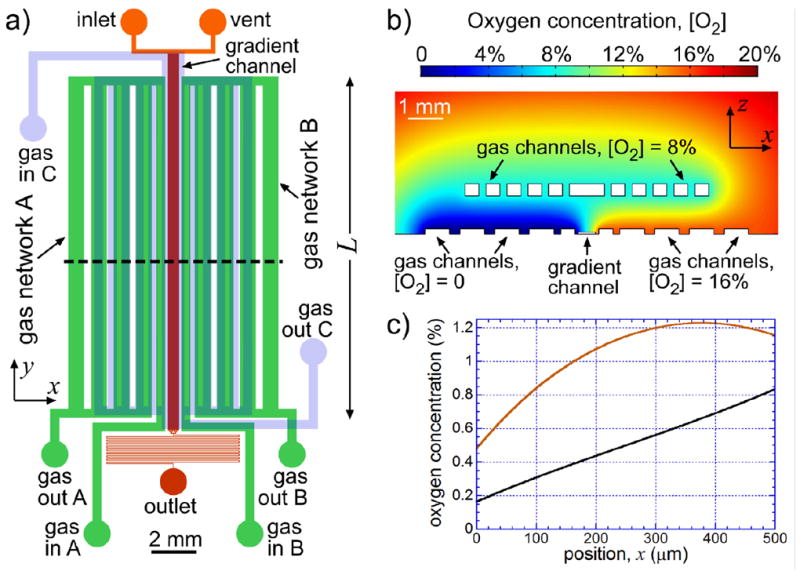
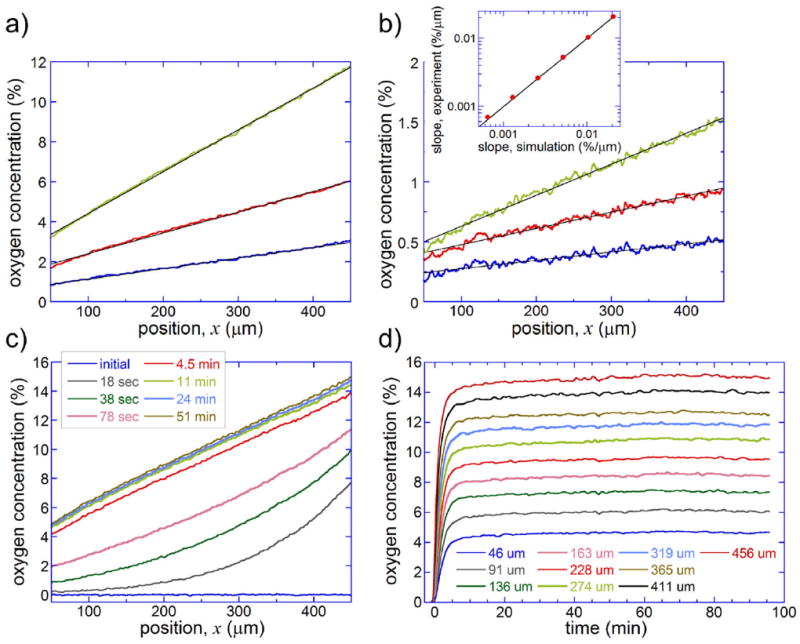
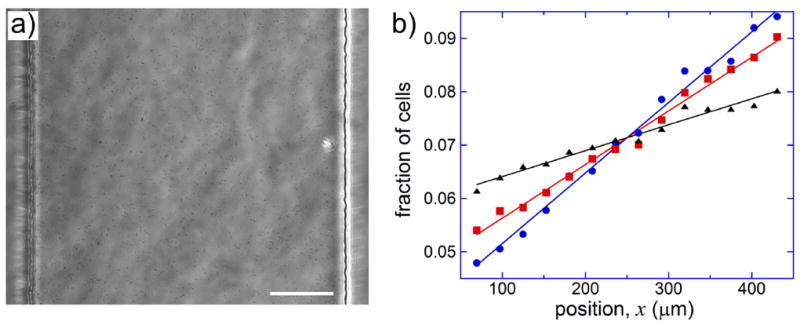
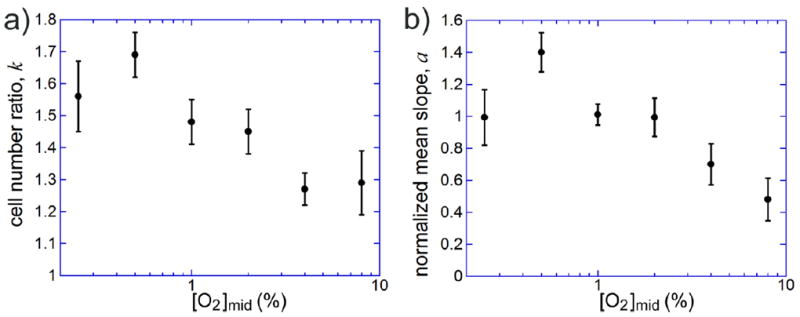
Aerotaxis, the directional motion of bacteria in gradients of oxygen, was discovered in the late 19th century and has since been reported in a variety of bacterial species. Nevertheless, quantitative studies of aerotaxis have been complicated by the lack of tools for generation of stable gradients of oxygen concentration, [O(2)]. Here we report a series of experiments on aerotaxis of Escherichia coli in a specially built experimental setup consisting of a computer-controlled gas mixer and a two-layer microfluidic device made of polydimethylsiloxane (PDMS). The setup enables generation of a variety of stable linear profiles of [O(2)] across a long gradient channel, with characteristic [O(2)] ranging from aerobic to microaerobic conditions. A suspension of E. coli cells is perfused through the gradient channel at a low speed, allowing cells enough time to explore the [O(2)] gradient, and the distribution of cells across the gradient channel is analyzed near the channel outlet at a throughput of >10(5) cells per hour. Aerotaxis experiments are performed in [O(2)] gradients with identical logarithmic slopes and varying mean concentrations, as well as in gradients with identical mean concentrations and varying slopes. Experiments in gradients with [O(2)] ranging from 0 to ~11.5% indicate that, in contrast to some previous reports, E. coli cells do not congregate at some intermediate level of [O(2)], but rather prefer the highest accessible [O(2)]. The presented technology can be applied to studies of aerotaxis of other aerobic and microaerobic bacteria.


Figures

Figure 1
Figure 1
Microfluidic device for experiments on bacterial aerotaxis. (a) Drawing of microchannels in the device. 37 μm and 150 μm deep liquid-filled channels in the lower layer are drawn in red and orange, respectively. 150 μm deep gas channels in the lower layer (in-plane networks A and B) are drawn in green, and 340 μm deep gas channels in the upper layer (out-of-plane network C) are drawn in partially transparent light blue, which is overlaid on the drawing of the lower layer channels. Gas inlets A, B, and C and gas outlets A, B, and C are labeled as gas in A, B, and C and gas out A, B, and C, respectively. (b) Results of a two-dimensional steady-state numerical simulation of the distribution of [O2] (color-coded) in the xz-cross-section of the PDMS chip along the dashed line in (a). The computational domain was 20×5 mm (size of the chip) with an impermeable boundary at the bottom (cover glass) and [O2] = 20.8% at the top and on the sides. Other boundary conditions were [O2] = 0 at the boundaries of the gas channel network A, [O2] = 16% at the boundaries of the gas channel network B, and [O2] = 8% at the boundaries of the gas channel network C. A bottom-central 11×4 mm fragment of the computational domain is shown. (c) [O2] as a function of the position across the gradient channel, x, counted from the left edge from a numerical simulation with [O2]A = 0, [O2]B = 1%, and [O2]C = 0.5% (black curve). Red curve shows results of a simulation for a device without the gas channel network C, with [O2]A = 0 and [O2]B = 1%.
Figure 2
Figure 2
Profiles of [O2] across the gradient channel evaluated from measurements of RTDP fluorescence intensity. (a) [O2] as a function of position, x, across the gradient channel for [O2]B = 4% (blue curve), 8% (red curve), and 16% (green curve). In all cases, [O2]A = 0 and [O2]C = 0.5[O2]B. Black lines are linear fits. (b) [O2] as a function of x for [O2]B = 0.5% (blue curve), 1% (red curve), and 2% (green curve). [O2]A = 0 and [O2]C = 0.5[O2]B in all cases. Black lines are linear fits. Inset: slopes of the linear fits to the experimental curves vs. slopes of linear fits to the results of numerical simulations at the same [O2] settings (red circles). Black line corresponds to identical experimental and numerically calculated slopes. (c) Profiles of [O2] vs. x at different time intervals (as stated in the legend), after [O2]A, [O2]B, and [O2]C have been abruptly switched from their initial value of 0 (pure N2 in all gas channels) to 0, 20.8, and 10.4%, respectively. (d) [O2] as a function of time for different selected positions, x, as stated in the legend (with um standing for μm), after [O2]A, [O2]B, and [O2]C have been switched from 0 to 0, 20.8, and 10.4%, respectively.
Figure 3
Figure 3
Distributions of E. coli cells in the gradient channel of the microfluidic device. (a) A brightfield micrograph of the gradient channel with E. coli cells taken at [O2]A = 0, [O2]B = 1%, and [O2]C = 0.5% using a 20×/0.75 objective lens. The lens did not have a phase ring, and to enhance the contrast, the microfluidic device was illuminated with a narrow beam directed at an angle to the vertical, resulting in visible short-range non-uniformity of illumination. Scale bar is 100 μm. (b) Fraction of E. coli cells in various ~30 μm wide segments of the gradient channel (x-axis extension) as a function of the position of the segment center, x, at [O2]B = 1% (blue circles), 4% (red squares), and 16% (black triangles). Each set of data points is fitted by a color-matching straight line. For all data sets [O2]A = 0 and [O2]C = 0.5[O2]B. The data was collected on the same day within several hours. The total number of interrogated cells was 0.6·105, 1.2·105, and 1.8·105 for [O2]B of 1%, 4%, and 16% respectively.
Figure 4
Figure 4
Results of aerotaxis assays on E. coli cells in linear profiles of [O2] at the gas inlet concentrations [O2]A = 0 and [O2]C = 0.5[O2]B, such that [O2] in the middle of the gradient channel, [O2]mid, is equal to [O2]C, and the representative logarithmic slope of the [O2] profile in the gradient channel, Δ[O2]/(w·[O2]mid), is 2.7·10-3 μm-1. The middle ~400 μm wide part of the gradient channel was divided into 14 equal segments along the x-axis, the fractions of E. coli cells in individual segments were measured, the distributions were fitted with straight lines, and the ratios of cell numbers between the last and first segments, k, were calculated from the slopes, a, of the linear fits. The ratio of [O2] between the centers of the last and first segment was ~2.8 in all experiments. (a) Cell number ratio, k, as a function of [O2]mid. The numbers of experiments, N, are 11, 8, 13, 11, 12, and 6 for [O2]mid = 0.25, 0.5, 1, 2, 4, and 8%, respectively, with an average of 7·104 cells interrogated in an experiment. Error bars are SEM. (b) Mean value of the slope of the linear fit, a, normalized to the slope of the fit to the distribution in the gradient with [O2]mid = 1% on the same day of experimentation, as a function of [O2]mid. Error bars are SEM.
Figure 5
Figure 5
Results of aerotaxis assays on E. coli cells in linear profiles of [O2] at [O2]mid = [O2]C = 2%, with [O2]B + [O2]A = 2[O2]C and Δ[O2]BA = [O2]B - [O2]A varied between 0 and 4%, resulting in constant mid-point gradients of [O2] with logarithmic slopes, Δ[O2]/(w·[O2]mid) = 0.68Δ[O2]BA/(w·[O2]mid), varying between 0 and 2.7·10-3 μm-1. The data analysis was the same as in the experiments with a constant logarithmic slope (Fig. 4). (a) Cell number ratio, k, between the last and the first segment of the gradient channel (~360 μm apart) as a function of Δ[O2]BA. The numbers of experiments, N, are 2, 8, 9, 8, and 8 for Δ[O2]BA = 0, 0.5, 1, 2, and 4%, respectively, with an average of 9·104 cells per experiment. Error bars are SEM. (b) Mean value of the slope of the linear fit, a, normalized to the slope of the fit to the distribution in the gradient with Δ[O2]BA = 2% on the same day of experimentation, as a function of Δ[O2]BA. Error bars are SEM.

References

    1. Engelmann T. Pflugers Arch Gesammte Physiol. 1881;25:285–292.
    1. Taylor BL, Zhulin IB, Johnson MS. Annu Rev Microbiol. 1999;53:103–128. - PubMed
    1. Baracchini O, Sherris JC. Journal Of Pathology And Bacteriology. 1959;77:565–574. - PubMed
    1. Wong LS, Johnson MS, Zhulin IB, Taylor BL. J Bacteriol. 1995;177:3985–3991. - PMC - PubMed
    1. Rebbapragada A, Johnson MS, Harding GP, Zuccarelli AJ, Fletcher HM, Zhulin IB, Taylor BL. PNAS. 1997;94:10541–10546. - PMC - PubMed

Publication types

MeSH terms