Pilot results of in vivo brain glutathione measurements in stroke patients
- PMID: 23010948
- PMCID: PMC3519413
- DOI: 10.1038/jcbfm.2012.127
Pilot results of in vivo brain glutathione measurements in stroke patients
Abstract
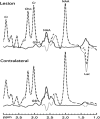
Measurement of glutathione concentration for the study of redox status in subjects with neurological disease has been limited to peripheral markers. We recruited 19 subjects with large strokes. Using magnetic resonance spectroscopy we measured brain glutathione concentration in the stroke region and in healthy tissue to calculate a glutathione-ratio. Elevated glutathione-ratio was observed in subacute (<72 hours) subjects without hemorrhagic transformation (mean=1.19, P=0.03, n=6). No trend was seen when all subjects were considered (n=19, 3 to 754 hours, range=0.45 to 1.41). This technique can detect glutathione changes because of disease, and may be valuable in clinical trials of stroke and other neurological diseases.
Figures

References
-
- Ross D, Cotgreave I, Moldeus P. The interaction of reduced glutathione with active oxygen species generated by xanthine-oxidase-catalyzed metabolism of xanthine. Biochem Biophys Acta. 1985;841:278–282. - PubMed
-
- Chance B, Sies H, Boveris A. Hydroperoxide metabolism in mammalian organs. Physiol Rev. 1979;59:527–605. - PubMed
-
- Rice ME, Russo-Menna I. Differential compartmentalization of brain ascorbate and glutathione between neurons and glia. Neuroscience. 1998;82:1213–1223. - PubMed
-
- Akerboom TP, Sies H. Assay of glutathione, glutathione disulfide, and glutathione mixed disulfides in biological samples. Methods Enzymol. 1981;77:373–382. - PubMed
-
- Anderson ME. Determination of glutathione and glutathione disulfide in biological samples. Methods Enzymol. 1985;113:548–555. - PubMed
Publication types
MeSH terms
Substances
Grants and funding
LinkOut - more resources
Full Text Sources
Medical

