. 2012:8:613.
doi: 10.1038/msb.2012.45.

Noise drives sharpening of gene expression boundaries in the zebrafish hindbrain

Affiliations

Noise drives sharpening of gene expression boundaries in the zebrafish hindbrain

Lei Zhang et al. Mol Syst Biol. 2012.

Abstract

Morphogens provide positional information for spatial patterns of gene expression during development. However, stochastic effects such as local fluctuations in morphogen concentration and noise in signal transduction make it difficult for cells to respond to their positions accurately enough to generate sharp boundaries between gene expression domains. During development of rhombomeres in the zebrafish hindbrain, the morphogen retinoic acid (RA) induces expression of hoxb1a in rhombomere 4 (r4) and krox20 in r3 and r5. Fluorescent in situ hybridization reveals rough edges around these gene expression domains, in which cells co-express hoxb1a and krox20 on either side of the boundary, and these sharpen within a few hours. Computational analysis of spatial stochastic models shows, surprisingly, that noise in hoxb1a/krox20 expression actually promotes sharpening of boundaries between adjacent segments. In particular, fluctuations in RA initially induce a rough boundary that requires noise in hoxb1a/krox20 expression to sharpen. This finding suggests a novel noise attenuation mechanism that relies on intracellular noise to induce switching and coordinate cellular decisions during developmental patterning.


Conflict of interest statement

The authors declare that they have no conflict of interest.

Figures
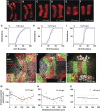
Figure 1
Figure 1
Sharpening of gene expression boundaries in the zebrafish hindbrain. (AF) Single confocal images of fluorescent in situ hybridization (FISH) for krox20 (red) mRNA, dorsal views, anterior to the left, between 10.7 and 12.7 h post fertilization (h.p.f.). (GI) Fluorescence measurements at different positions along the anterior-posterior axis (X axis) at 11, 11.7, and 12.7 h.p.f. Lines represent four different samples. (JL) Single confocal images of two-color FISH for hoxb1a (r4, red) and krox20 (r3 and r5, green). Insets show enlargements of cells co-expressing both (yellow). (MO) Sample distributions of mis-expressing cells along the r4/5 boundary (black lines) between 10.7 and 12 h.p.f., anterior to the top. Cells mis-expressing krox20—green dots, hoxb1a—red dots and co-expressing cells—orange dots.
Figure 2
Figure 2
Modeling induction of hoxb1a and krox20 expression by a gradient of retinoic acid (RA) in a noise-free system. (A) Diagram illustrating RA movement from extracellular [RA]out to intracellular [RA]in, self-enhanced degradation via Cyp26a1, and induction of hoxb1a and krox20 which undergo auto-activation and cross-inhibition. (B) In the absence of noise, a smooth RA gradient leads to sharp boundaries of gene expression—as long as there is a low initial level of hoxb1a (∼0.1). (C) Three-dimensional graph of krox20 (gk, Y axis) and hoxb1a (gh, Z axis) expression levels at different points along the RA gradient (X axis). The number of possible gene states is 5 (0<[RA]in<0.22), 3 (0.22<[RA]in<0.85), and 1 ([RA]in>0.85) for a normalized RA concentration. (D) Phase diagram of Hoxb1 (red) and Krox20 (blue) activation illustrating effects of the initial level of Hoxb1 (Y axis) at different segmental positions (X axis). The initial level of krox20 is zero and the RA gradient used to generate the diagram is shown in (B).
Figure 3
Figure 3
Effects of noise either in the RA gradient or in hoxb1a/krox20 expression alone on boundary sharpening. (AC) With noise in RA alone, boundaries are initially rough and never sharpen. (DF) With noise in hoxb1a/krox20 expression alone boundaries start out sharp at the outset and remain sharp. (A, D) Single samples at three time points illustrating gene expression levels (Y axis) at different A-P positions in r3-5 (X axis). (B, E) Gene expression distributions (Y axis) at different positions relative to the r4/5 boundary (X axis). Solutions are at the scaled time T=50, which is typically long enough for simulations to reach steady state (1000 samples are taken to calculate the gene distributions). (C, F) 2D simulations at three time points showing the pattern of hoxb1a/krox20 gene expression around the r4/5 boundary (hoxb1a: blue; krox20: red).
Figure 4
Figure 4
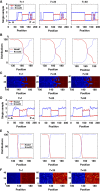
Noise in hoxb1a/krox20 expression leads to boundary sharpening. (A) Minimum Action Paths (dash lines) at [RA]in=0.1, 0.5, and 0.8 (krox20-on: blue dot, hoxb1a-on: red dot, both-off: black dot, critical point: green dot). (B) Gene switching probability estimated by MAPs reveals that noise in gene expression can drive cells from co-expressing Hoxb1/Krox20 to uniform Krox20 expression when [RA]in is high, and this coincides with the results of Monte Carlo simulations. (CE) With noise in both [RA]in and hoxb1a/krox20 expression, a transient noisy boundary becomes sharp over time: (C) single sample; (D) gene distribution at the r4/5 boundary (1000 samples are taken to calculate the gene distributions); (E) two-dimensional simulation at the r4/5 boundary (hoxb1a: blue; krox20: red). (F) Sharpness Index versus time. ‘green dashed line’: noise only in extracellular RA alone; ‘black dashed-dotted line’: noise in both extracellular and intracellular RA; ‘magenta dotted line’: noise in gene expression alone; ‘blue solid line’: noise interactions between RA and gene expression; ‘red dashed line with green squares’: mean value of the Sharpness Index for distributions of Krox20 obtained from the experimental data. The error bar represents the standard error of the mean. The times 11, 11.3, 11.7, 12, and 12.7 h.p.f. correspond 3, 4, 5, 6, and 8 somites, respectively, and are rescaled to 1, 9, 20, 29, and 50.
Figure 5
Figure 5
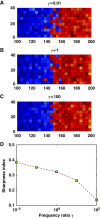
A larger noise frequency ratio improves boundary sharpening. (AC) Two-dimensional simulations of hoxb1a/krox20 gene expression at T=50 for the ratio of the frequency of noise in RA over the frequency of noise in gene expression at three different values: (A) γ=0.01; (B) γ=1; (C) γ=100 (hoxb1a: blue; krox20: red). (D) Sharpness Index versus frequency ratio.
Figure 6
Figure 6
Growth of the embryo delays boundary sharpening. (A) Mean values of the intracellular RA gradient along the X axis at different times, showing a growth-dependent fading of RA levels (see one sample of two-dimensional RA gradients in Supplementary Figure S9A). (B) The pattern of hoxb1a/krox20 gene expression during growth (hoxb1a: blue; krox20: red).

References

    1. Alexander T, Nolte C, Krumlauf R (2009) Hox genes and segmentation of the hindbrain and axial skeleton. Annu Rev Cell Dev Biol 25: 431–456 - PubMed
    1. Balaskas N, Ribeiro A, Panovska J, Dessaud E, Sasai N, Page KM, Briscoe J, Ribes V (2012) Gene regulatory logic for reading the sonic hedgehog signaling gradient in the vertebrate neural tube. Cell 148: 273–284 - PMC - PubMed
    1. Balazsi G, van Oudenaarden A, Collins JJ (2011) Cellular decision making and biological noise: from microbes to mammals. Cell 144: 910–925 - PMC - PubMed
    1. Barrow JR, Stadler HS, Capecchi MR (2000) Roles of Hoxa1 and Hoxa2 in patterning the early hindbrain of the mouse. Development 127: 933–944 - PubMed
    1. Begemann G, Schilling TF, Rauch GJ, Geisler R, Ingham PW (2001) The zebrafish neckless mutation reveals a requirement for raldh2 in mesodermal signals that pattern the hindbrain. Development 128: 3081–3094 - PubMed

Publication types

MeSH terms