
Novel biomarkers for pre-diabetes identified by metabolomics

Rui Wang-Sattler et al. Mol Syst Biol. 2012.

Abstract

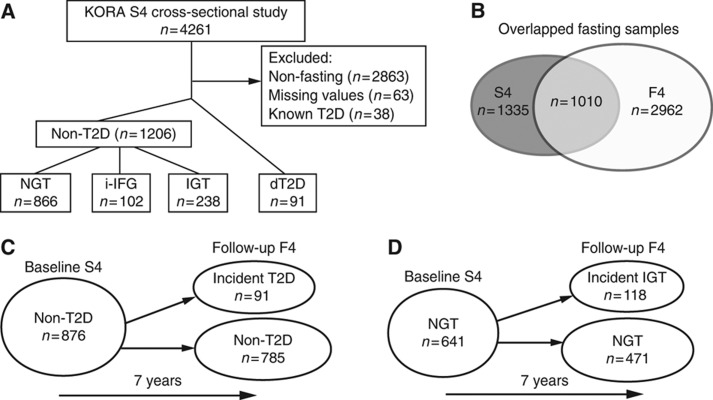
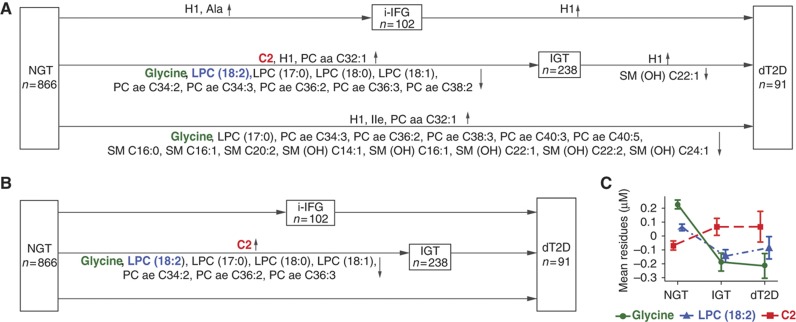
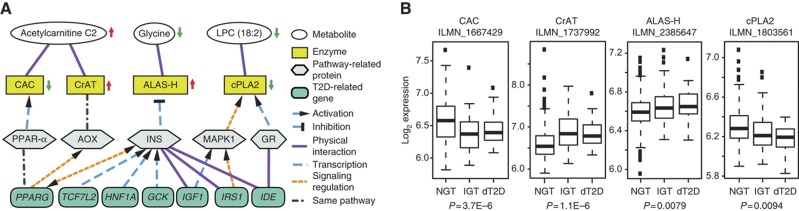
Type 2 diabetes (T2D) can be prevented in pre-diabetic individuals with impaired glucose tolerance (IGT). Here, we have used a metabolomics approach to identify candidate biomarkers of pre-diabetes. We quantified 140 metabolites for 4297 fasting serum samples in the population-based Cooperative Health Research in the Region of Augsburg (KORA) cohort. Our study revealed significant metabolic variation in pre-diabetic individuals that are distinct from known diabetes risk indicators, such as glycosylated hemoglobin levels, fasting glucose and insulin. We identified three metabolites (glycine, lysophosphatidylcholine (LPC) (18:2) and acetylcarnitine) that had significantly altered levels in IGT individuals as compared to those with normal glucose tolerance, with P-values ranging from 2.4×10(-4) to 2.1×10(-13). Lower levels of glycine and LPC were found to be predictors not only for IGT but also for T2D, and were independently confirmed in the European Prospective Investigation into Cancer and Nutrition (EPIC)-Potsdam cohort. Using metabolite-protein network analysis, we identified seven T2D-related genes that are associated with these three IGT-specific metabolites by multiple interactions with four enzymes. The expression levels of these enzymes correlate with changes in the metabolite concentrations linked to diabetes. Our results may help developing novel strategies to prevent T2D.


Conflict of interest statement

The authors declare that they have no conflict of interest.

Figures

Figure 1
Figure 1
Population description. Metabolomics screens in the KORA cohort, at baseline S4 (A), overlapped between S4 and F4 (B) and prospective (C, D). Participant numbers are shown. Normal glucose tolerance (NGT), isolated impaired fasting glucose (i-IFG), impaired glucose tolerance (IGT), type 2 diabetes mellitus (T2D) and newly diagnosed T2D (dT2D). Non-T2D individuals include NGT, i-IFG and IGT participants.
Figure 2
Figure 2
Differences in metabolite concentrations from cross-sectional analysis of KORA S4. Plots (A, B) show the names of metabolites with significantly different concentrations in multivariate logistic regression analyses (after the Bonferroni correction for multiple testing with P<3.6 × 10⁻⁴) in the five pairwise comparisons of model 1 and model 2. Plot (C) shows the average residues of the concentrations with standard errors of the three metabolites (glycine, LPC (18:2) and acetylcarnitine C2) for the NGT, IGT and dT2D groups. Plot (A) shows the results with adjustment for model 1 (age, sex, BMI, physical activity, alcohol intake, smoking, systolic BP and HDL cholesterol), whereas plots (B, C) have additional adjustments for HbA1c, fasting glucose and fasting insulin (model 2). Residuals were calculated from linear regression model (formula: T2D status∼metabolite concentration+model 2). For further information, see Supplementary Table S4.
Figure 3
Figure 3
Three candidate metabolites for IGT associated with seven T2D-related genes. (A) Metabolites (white), enzymes (yellow), pathway-related proteins (gray) and T2D-related genes (blue) are represented with ellipses, rectangles, polygons and rounded rectangles, respectively. Arrows next to the ellipses and rectangles indicate altered metabolite concentrations in persons with IGT as compared with NGT, and enzyme activities in individuals with IGT. The 21 connections between metabolites, enzymes, pathway-related proteins and T2D-related genes were divided after visual inspections into four categories: physical interaction (purple solid line), transcription (blue dash line), signaling regulation (orange dash line) and same pathway (gray dot and dash line). The activation or inhibition is indicated. For further information, see Supplementary Table S12. (B) Log-transformed gene expression results of the probes of CAC, CrAT, ALAS-H and cPLA2 in 383 individuals with NGT, 104 with IGT and 26 patients with dT2D are shown from cross-sectional analysis of the KORA S4 survey. The P-values were adjusted for sex, age, BMI, physical activity, alcohol intake, smoking, systolic BP, HDL cholesterol, HbA1c and fasting glucose when IGT individuals were compared with NGT participants.

References

    1. ADA. (2010) Executive summary: standards of medical care in diabetes--2010. Diabetes Care 33: Suppl 1S4–S10 - PMC - PubMed
    1. Adams SH, Hoppel CL, Lok KH, Zhao L, Wong SW, Minkler PE, Hwang DH, Newman JW, Garvey WT (2009) Plasma acylcarnitine profiles suggest incomplete long-chain fatty acid beta-oxidation and altered tricarboxylic acid cycle activity in type 2 diabetic African-American women. J Nutr 139: 1073–1081 - PMC - PubMed
    1. Altmaier E, Kastenmuller G, Romisch-Margl W, Thorand B, Weinberger KM, Illig T, Adamski J, Doring A, Suhre K (2011) Questionnaire-based self-reported nutrition habits associate with serum metabolism as revealed by quantitative targeted metabolomics. Eur J Epidemiol 26: 145–156 - PubMed
    1. Bergmann MM, Bussas U, Boeing H (1999) Follow-up procedures in EPIC-Germany--data quality aspects. European Prospective Investigation into Cancer and Nutrition. Ann Nutr Metab 43: 225–234 - PubMed
    1. Bishop DF (1990) Two different genes encode delta-aminolevulinate synthase in humans: nucleotide sequences of cDNAs for the housekeeping and erythroid genes. Nucleic Acids Res 18: 7187–7188 - PMC - PubMed

Publication types