. 2013 Feb;62(2):478-89.
doi: 10.2337/db11-1116. Epub 2012 Sep 25.

Receptor for advanced glycation end products regulates adipocyte hypertrophy and insulin sensitivity in mice: involvement of Toll-like receptor 2

Affiliations

Receptor for advanced glycation end products regulates adipocyte hypertrophy and insulin sensitivity in mice: involvement of Toll-like receptor 2

Masayo Monden et al. Diabetes. 2013 Feb.

Abstract

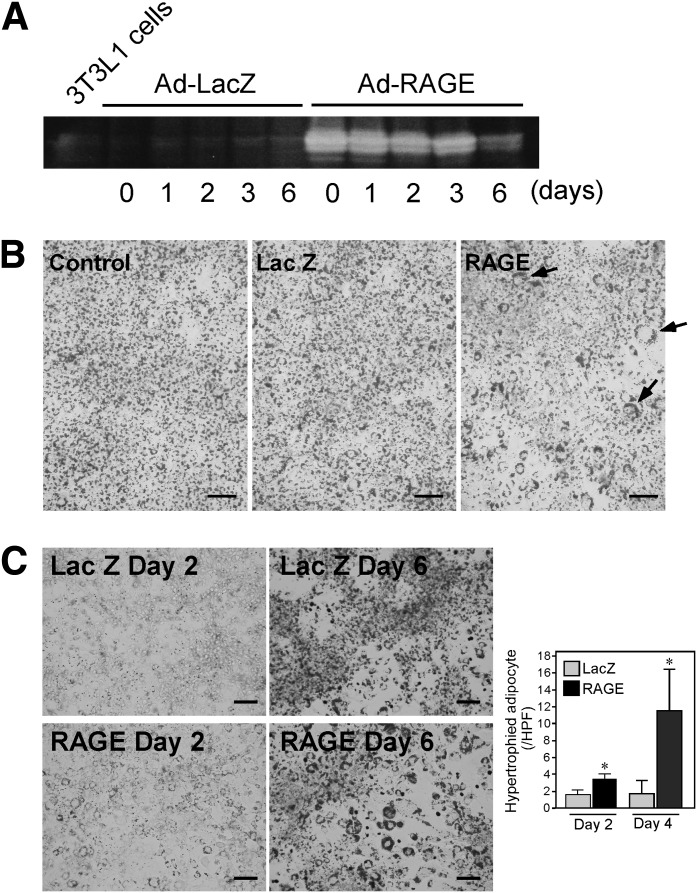
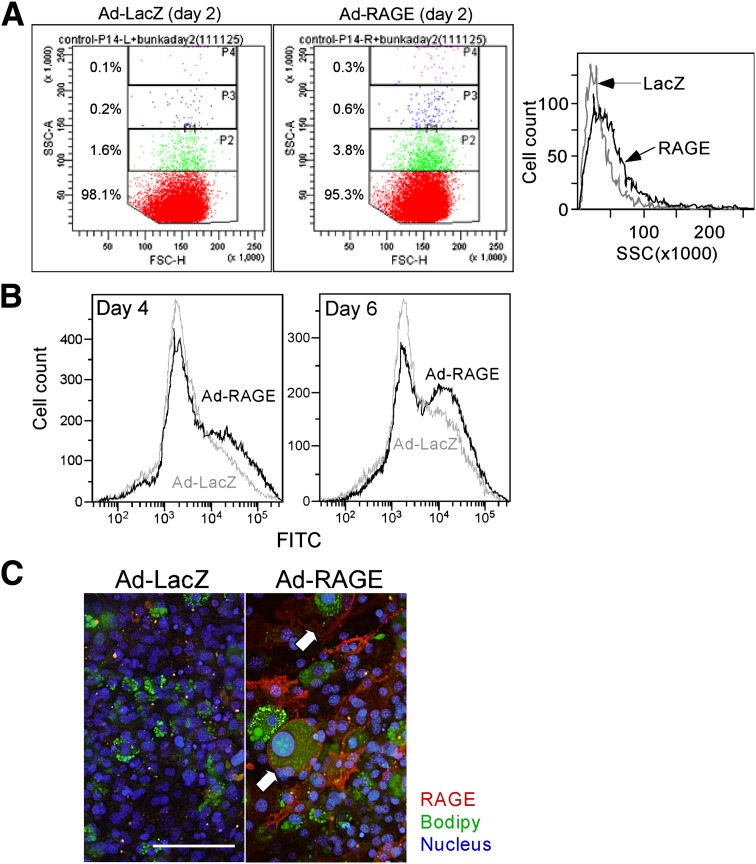
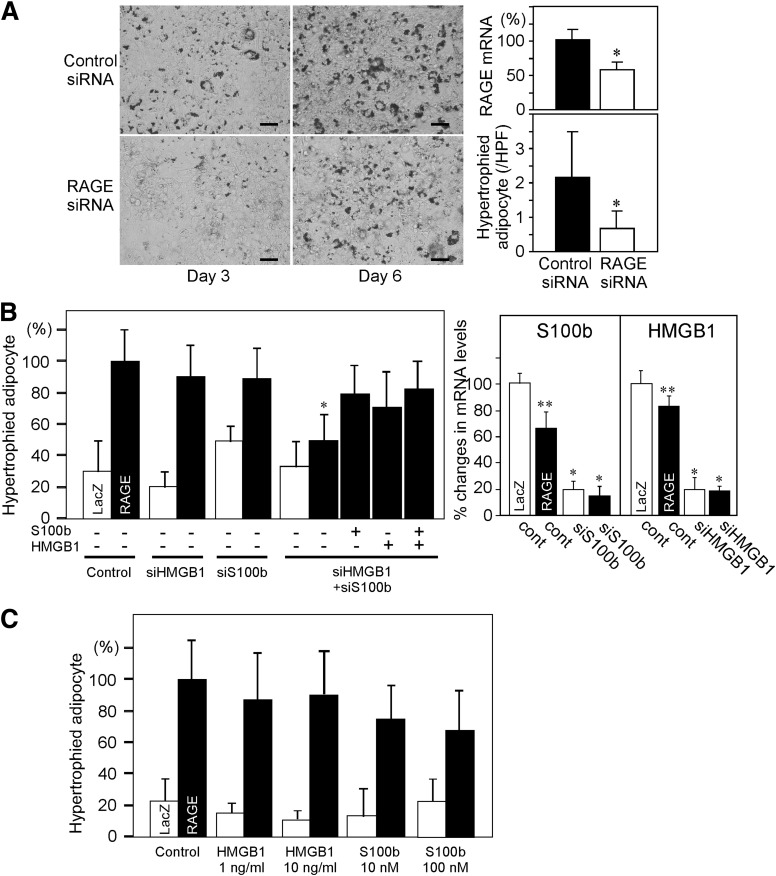
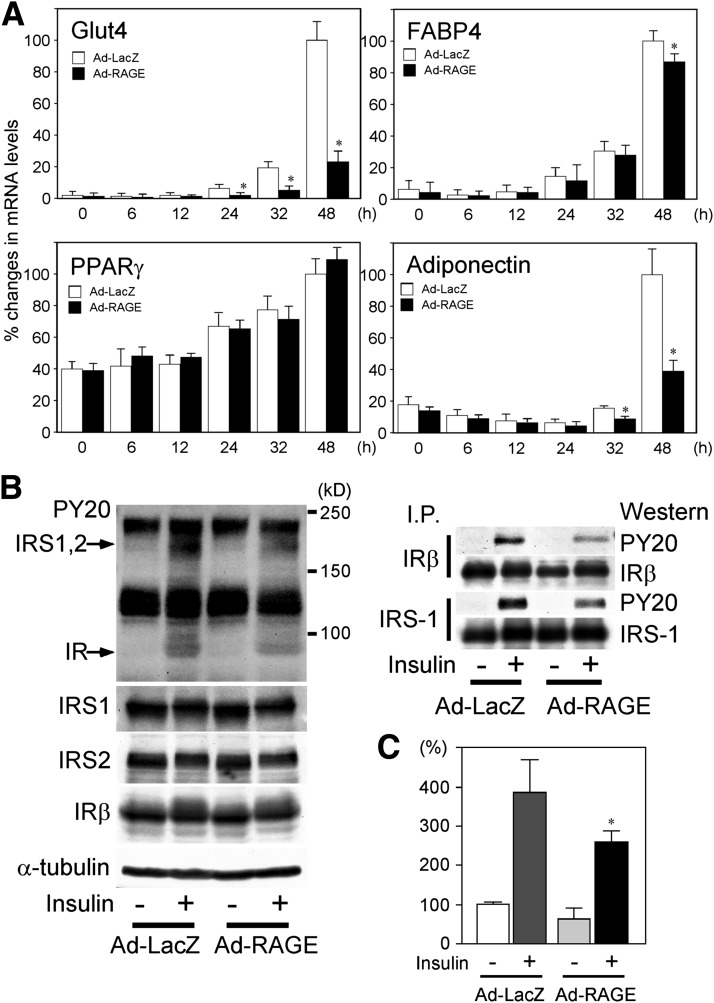
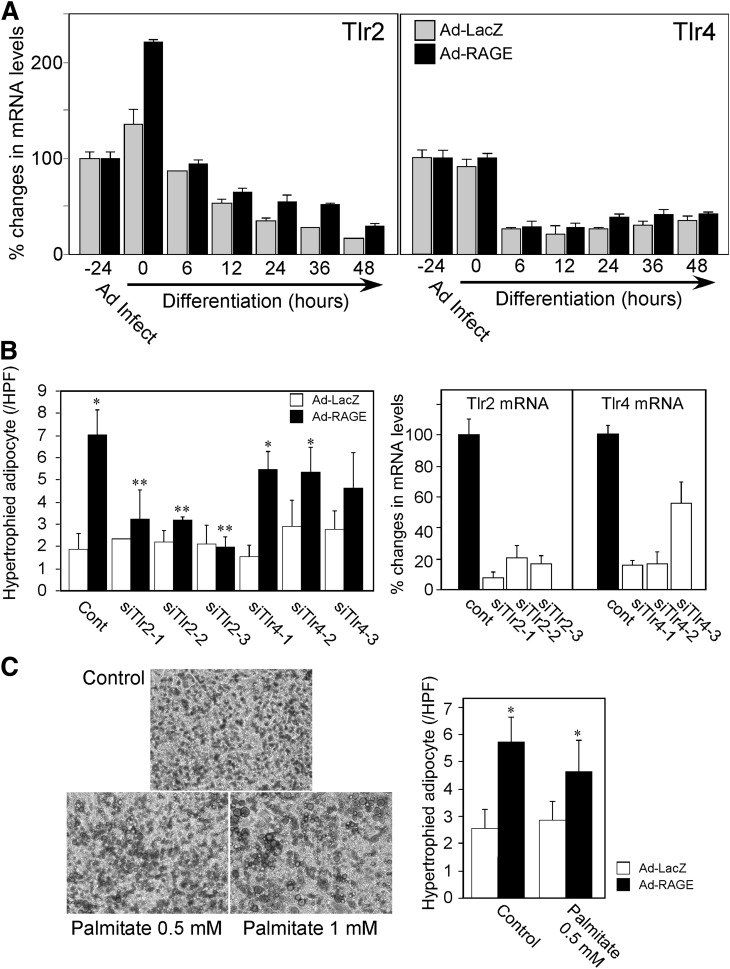
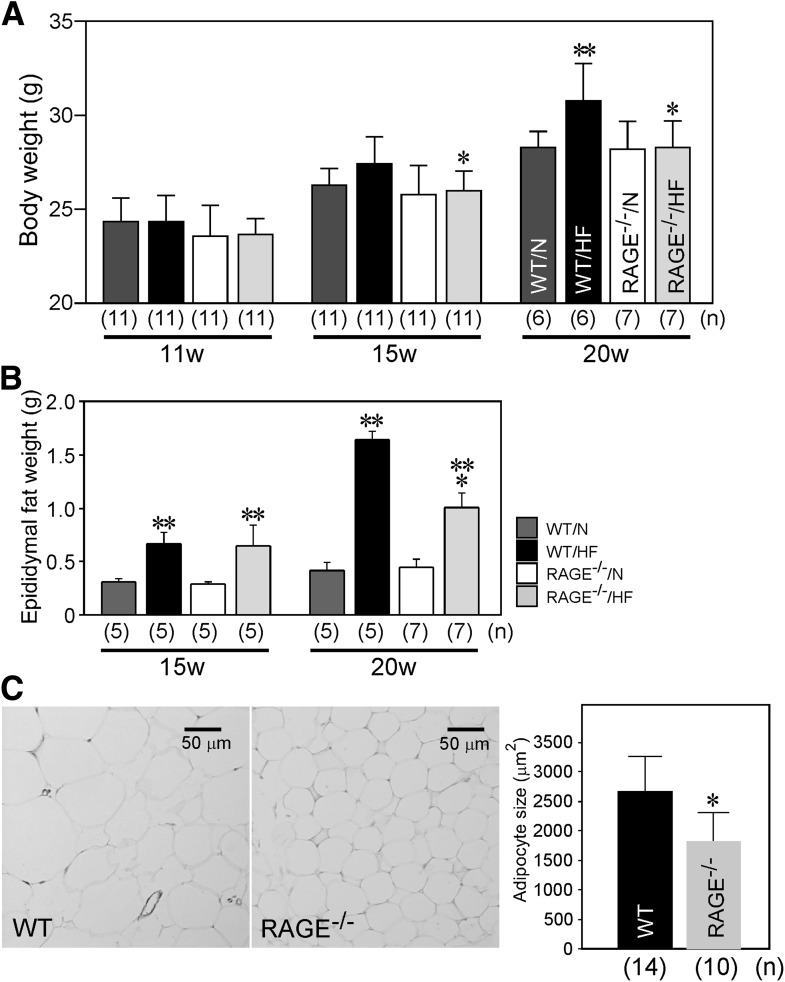
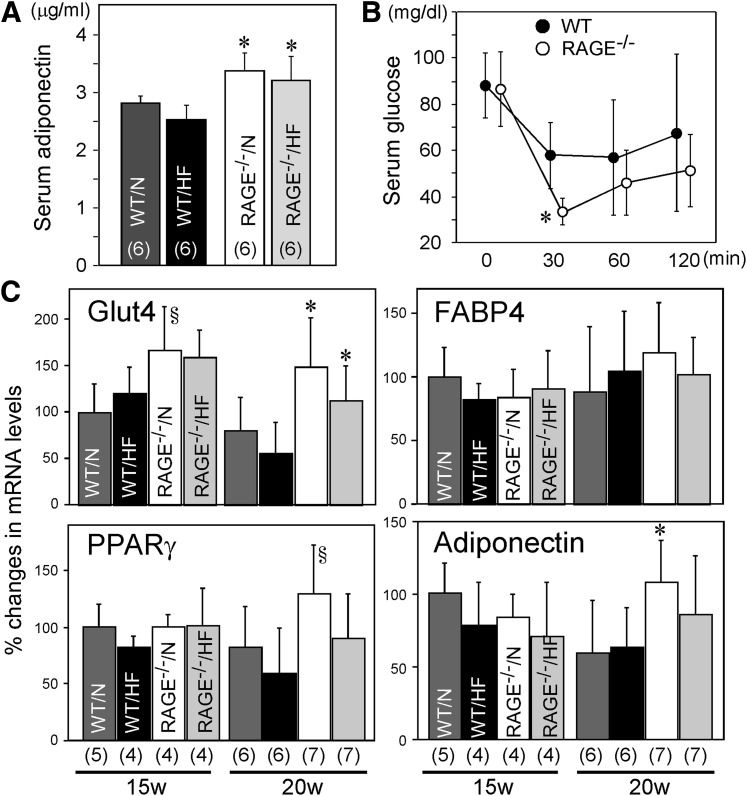
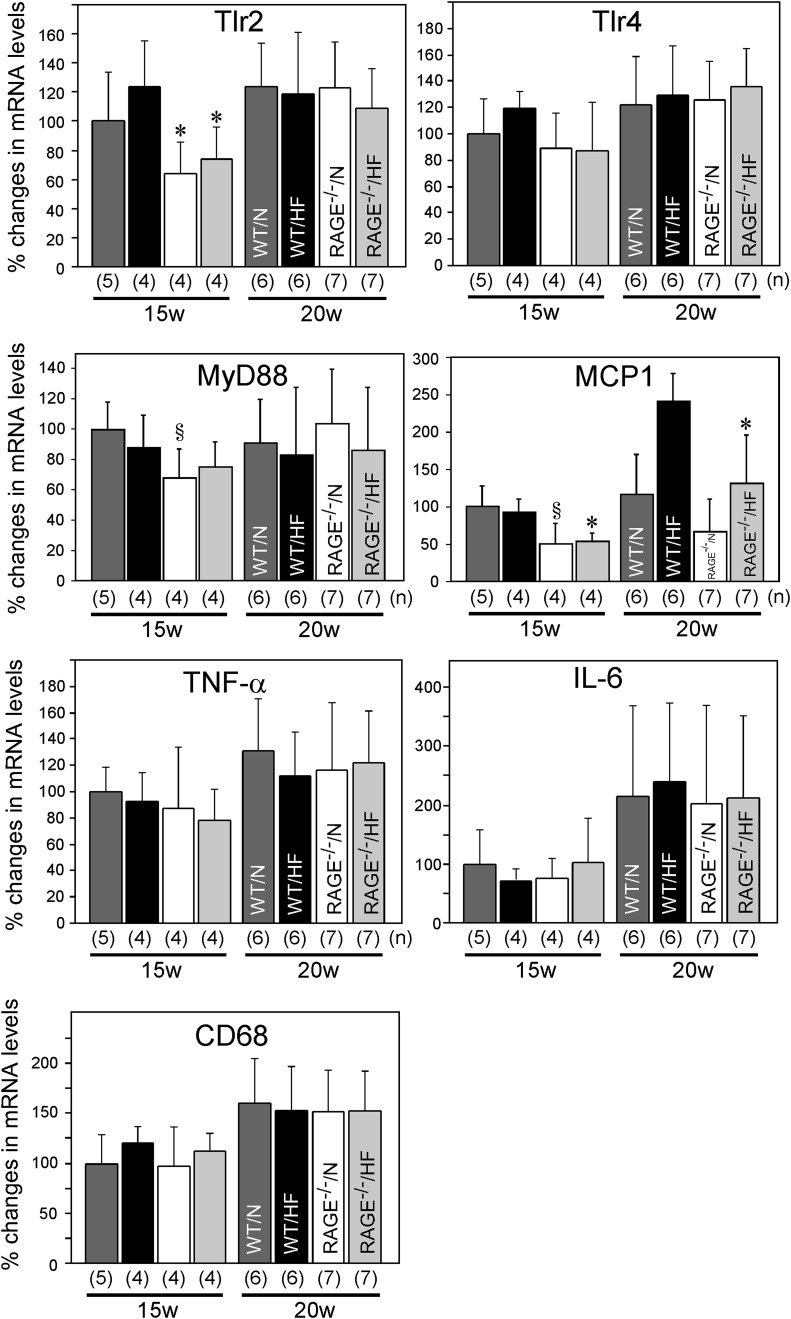
Receptor for advanced glycation end products (RAGE) has been shown to be involved in adiposity as well as atherosclerosis even in nondiabetic conditions. In this study, we examined mechanisms underlying how RAGE regulates adiposity and insulin sensitivity. RAGE overexpression in 3T3-L1 preadipocytes using adenoviral gene transfer accelerated adipocyte hypertrophy, whereas inhibitions of RAGE by small interfering RNA significantly decrease adipocyte hypertrophy. Furthermore, double knockdown of high mobility group box-1 and S100b, both of which are RAGE ligands endogenously expressed in 3T3-L1 cells, also canceled RAGE-medicated adipocyte hypertrophy, implicating a fundamental role of ligands-RAGE ligation. Adipocyte hypertrophy induced by RAGE overexpression is associated with suppression of glucose transporter type 4 and adiponectin mRNA expression, attenuated insulin-stimulated glucose uptake, and insulin-stimulated signaling. Toll-like receptor (Tlr)2 mRNA, but not Tlr4 mRNA, is rapidly upregulated by RAGE overexpression, and inhibition of Tlr2 almost completely abrogates RAGE-mediated adipocyte hypertrophy. Finally, RAGE(-/-) mice exhibited significantly less body weight, epididymal fat weight, epididymal adipocyte size, higher serum adiponectin levels, and higher insulin sensitivity than wild-type mice. RAGE deficiency is associated with early suppression of Tlr2 mRNA expression in adipose tissues. Thus, RAGE appears to be involved in mouse adipocyte hypertrophy and insulin sensitivity, whereas Tlr2 regulation may partly play a role.


Figures

FIG. 1.
FIG. 1.
RAGE overexpression in 3T3L1 preadipocytes accelerates adipocyte hypertrophy. Confluent 3T3L1 cells were infected with human RAGE- or control β-galactosidase (LacZ)–expressing adenovirus. At day 0, differentiation was initiated by the addition of 10% FBS, 1 μmol/L insulin, and 0.5 mmol/L isobutylmethyl xanthine, and 0.25 μmol/L dexamethasone for 2 days. Then, the cells were cultured for 2 more days in 10% FBS and 1 μmol/L insulin (day 2–4). The cells were then maintained in 10% FBS medium for 2 days (day 4–6). A: At indicated days of differentiation, RAGE protein expression in 3T3L1 cells was determined by Western blot analyses using goat anti-human RAGE antibody. Adenoviral overexpression of RAGE was maintained up until day 6 during adipocyte differentiation. B: Oil Red O staining of 3T3-L1 adipocytes was performed to determine adipogenesis at day 6. More hypertrophic adipocytes with ring-like lipid staining (arrows) were observed in RAGE-overexpressed cells. Control represents 3T3L1 cells without adenoviral infection. C: Oil Red O staining was performed at days 2 or 6 during differentiation. Numbers of hypertrophic adipocytes, as defined as cells with ring-like lipid droplets, were counted in five random fields (×20 power) scanned by BioZero fluorescent microscope (Keyence). Each column represents mean ± SD. Scale bars, 100 μm. *P < 0.05, Student t test. HPF, high-power field.
FIG. 2.
FIG. 2.
Flow cytometric analysis for adipogenesis. Adipogenic differentiation of 3T3-L1 cells was analyzed by flow cytometry (FACS Canto; BD Biosciences) as described previously (19). Cells were briefly rinsed twice with prewarmed 0.25% trypsin-EDTA and then incubated for 5 min at 37°C. Cells were then gently resuspended in PBS, washed twice with PBS, resuspended in cold PBS, and kept on ice prior to flow cytometric analysis. A: Following differentiation process, the Ad-RAGE–infected cells with greater SSC were increased as early as day 2 as compared with Ad-LacZ–infected cells. Distribution of SSC intensity at day 6 is shown in the right panel. B: At days 4 and 6 of differentiation, Ad-LacZ– or Ad-RAGE–infected 3T3-L1 cells were stained for 1 h with 0.5 μmol/L BODIPY to analyze the proportion of lipid-laden cells prior to flow cytometry. Fluorescein isothiocyanate (FITC) intensity was analyzed to determine lipid-rich differentiated adipocytes. C: Double-immunofluorescent analyses for RAGE expression and lipid accumulation. 3T3-L1 preadipocytes were infected with Ad-RAGE or LacZ and then cultured with differentiation media. Expression of human RAGE in the differentiated 3T3-L1 adipocytes was analyzed at day 6, and the cells were costained with 0.5 μmol BODIPY to visualize adipocytes and with DAPI to visualize the nuclei. Scale bar, 100 μm. (A high-quality digital representation of this figure is available in the online issue.)
FIG. 3.
FIG. 3.
A: Endogenous RAGE expression is involved in adipocyte hypertrophy. 3T3-L1 preadipocytes were cultured in DMEM with 10% FBS for 2 days. The cells were harvested, suspended, and transfected with predesigned siRNA for mouse RAGE using electroporation system. Twenty-four hours after siRNA transfection, the cells were infected with Ad-RAGE or Ad-LacZ. One day after adenoviral infection, differentiation was induced. Adipocyte differentiation was determined by Oil Red O staining 3 and 6 days after differentiation. Scale bars, 100 μm. *P < 0.05, Student t test. B: RAGE ligation with endogenous ligand(s) is indispensable for RAGE-stimulated adipocyte hypertrophy. The cells were transfected with siRNAs for control (cont), S100b alone, HMGB1 alone, or S100b + HMGB1, infected with Ad-LacZ or Ad-RAGE, and differentiated as described in A. In S100b and HMGB1 double-knockdown condition, addition of S100b (100 nmol/L), HMGB1 (10 ng/mL) alone, or both ligands during differentiation step negates the effect of siRNAs. Right panel shows the effect of RAGE overexpression or the effects of siRNAs for S100b and HMGB1 on mRNA levels of respective ligands. *P < 0.05 vs. control, **P < 0.05 vs. LacZ, Student t test. C: Effects of RAGE ligands on adipocyte hypertrophy in the presence or absence of RAGE overexpression. Indicated concentrations of HMGB1 or S100b were added during differentiation step following adenoviral infection as described in A. HPF, high-power field.
FIG. 4.
FIG. 4.
A: mRNA expression of Glut4, FABP4, PPARγ, and adiponectin following adenoviral infection and differentiation induction. Confluent 3T3-L1 cells were infected with human RAGE- (Ad-RAGE) or control LacZ–expressing adenovirus (Ad-LacZ) (−24 h). At 0 h, differentiation was initiated, and total RNA was isolated at indicated hours of differentiation. mRNA expression of each of the genes was determined by quantitative real-time RT-PCR. mRNA expression levels of each mouse gene were determined by a comparative Ct method using 18S ribosomal RNA as endogenous reference, and mRNA level of Ad-LacZ at −24 h was expressed as 100%. *P < 0.05 vs. Ad-LacZ. B: Attenuated phosphorylation of insulin receptor (IR) or IRS in RAGE-overexpressing adipocytes. At day 6 of differentiation period, adipocytes were serum-starved overnight and subsequently stimulated with 100 nmol/L insulin for 10 min. Phosphorylation of IR and IRS was determined by Western blot analyses using anti-phosphotyrosine (PY20, 1 μg/mL) antibody. After stripping, the blot was reprobed with antibodies recognizing murine IRS1 and IRS2 (1 μg/mL) and IR β-chain (1 μg/mL) to determine respective protein levels. Equal protein loading of the blot was evaluated by reprobing with anti–α-tubulin antibody. Right panel represents immunoblot following immunoprecipitation of IR or IRS1. Samples (500 μg) incubated with 2 μg of anti-IRβ or IRS1 antibody were immunoprecipitated with protein A-agarose. The protein was recovered and analyzed by immunoblotting as described above. I.P., precipitation. kD, kilodalton. C: Attenuated insulin-stimulated glucose uptake in RAGE-overexpressing adipocytes. At day 6 of differentiation period, adipocytes were serum-starved overnight and subsequently stimulated with 0.1 μmol/L insulin for 18 min. Glucose uptake was determined by 2-deoxyglucose uptake by an enzymatic photometric assay. *P < 0.05 vs. Ad-LacZ.
FIG. 5.
FIG. 5.
A: Tlr2 and Tlr4 mRNA expression following adenoviral infection and differentiation induction. Confluent 3T3-L1 cells were infected with human RAGE- (Ad-RAGE) or control LacZ–expressing adenovirus (Ad-LacZ) (−24 h). At 0 h, differentiation was initiated, and total RNA was isolated at indicated hours of differentiation. Tlr2 and Tlr4 mRNA expression was determined by quantitative real-time RT-PCR. mRNA expression levels of each mouse gene were determined by a comparative Ct method using 18S ribosomal RNA as endogenous reference, and mRNA level of Ad-LacZ–infected (Ad Infect) cells at −24 h was expressed as 100%. B: Knockdown of Tlr2, but not Tlr4, ameliorates adipocyte hypertrophy induced by RAGE overexpression. 3T3-L1 preadipocytes were cultured in DMEM with 10% FBS for 2 days. The cells were harvested, suspended, and transfected with predesigned siRNA for mouse Tlr2 (siTlr2-1–3; corresponding to three distinct regions of Tlr2) or Tlr4 (siTlr4-1–3; corresponding to three distinct regions of Tlr4) using electroporation system. Twenty-four hours after siRNA transfection, the cells were infected with Ad-RAGE or Ad-LacZ. One day after adenoviral infection, differentiation was induced. Hypertrophied adipocyte was determined by Oil Red O staining 6 days after differentiation. *P < 0.05 vs. Ad-LacZ, **P < 0.05 vs. control (Cont), Student t test. Right panel: Tlr2 and Tlr4 mRNA levels 24 h after respective siRNA transfection. C: Effects of palmitate, a Tlr2 ligand, on adipogenesis in 3T3-L1 preadipocytes. As shown in the left panel, addition of 0.5 or 1.0 mmol/L palmitate increased lipid droplet in adipocytes, but did not increase adipocytes with ring-like lipid staining. Right panel represents the effects of 1.0 mmol/L palmitate on adipocyte hypertrophy in the presence or absence of RAGE overexpression. HPF, high-power field. *P < 0.05 vs. Ad-LacZ.
FIG. 6.
FIG. 6.
RAGE deficiency is associated with decrease in body weight (A), adipose tissue weight (B), and adipocyte size (C) in mice. A: Increase in body weight induced by high-fat diet (HF) is suppressed in RAGE−/− mice at 15 and 20 weeks of age. B: Epididymal adipose tissues were isolated from WT and RAGE−/− mice fed either with normal (N) or HF diet at 15 and 20 weeks of age, and tissue weight was determined. All columns represent mean ± SD. C: Epididymal adipose tissues were isolated from WT or RAGE−/− mice at 20 weeks fed with HF diet, and adipocyte size was determined histochemically. Columns represent mean ± SD. *P < 0.05 vs. WT mice. **P < 0.05 vs. normal diet, Student t test. Numbers of animals are shown in parentheses.
FIG. 7.
FIG. 7.
A: Serum adiponectin levels at 20 weeks in WT or RAGE−/− mice fed either with normal (N) or high-fat (HF) diet. B: Insulin tolerance test was done in WT (n = 9; 18.0 ± 1.3 weeks of age) or RAGE−/− mice (n = 8; 18.1 ± 1.4 weeks of age) fed with normal diet as described in Research Design and Methods. Mice were injected with insulin (2.0 units/kg for mice) intraperitoneally after a 6-h fast. Blood samples were taken at indicated time points, and blood glucose levels were determined. Reproducible results were obtained in another set of experiments. C: Total RNA was isolated from epididymal adipose tissues obtained from WT or RAGE−/− mice fed either with N or HF diet at 15 or 20 weeks of age. mRNA levels of corresponding Glut4, FABP4, PPARγ, and adiponectin were determined by quantitative real-time RT-PCR. mRNA expression levels of each mouse gene were determined by a comparative Ct method using 18S ribosomal RNA as endogenous reference, and mRNA level of WT/N at 15 weeks was expressed as 100%. Columns represent mean ± SD. Numbers of animals are shown in parentheses. *P < 0.05 vs. WT mice, §P < 0.1 vs. WT, Student t test.
FIG. 8.
FIG. 8.
Tlr2, Tlr4, MyD88, MCP-1, TNF-α, IL-6, and CD68 mRNA levels in RAGE-deficient mice. Total RNA was isolated from epididymal adipose tissues obtained from WT or RAGE−/− mice fed either with normal (N) or high-fat (HF) diet at 15 or 20 weeks of age. Each mRNA level was determined by quantitative real-time RT-PCR. mRNA expression levels of each mouse gene were determined by a comparative Ct method using 18S ribosomal RNA as endogenous reference, and mRNA level of WT/N at 15 weeks was expressed as 100%. Columns represent mean ± SD. *P < 0.05 vs. WT mice, §P < 0.1 vs. WT, Student t test. Numbers of animals are shown in parentheses.

References

    1. Schmidt AM, Vianna M, Gerlach M, et al. Isolation and characterization of two binding proteins for advanced glycosylation end products from bovine lung which are present on the endothelial cell surface. J Biol Chem 1992;267:14987–14997 - PubMed
    1. Neeper M, Schmidt AM, Brett J, et al. Cloning and expression of a cell surface receptor for advanced glycosylation end products of proteins. J Biol Chem 1992;267:14998–15004 - PubMed
    1. Kislinger T, Fu C, Huber B, et al. N(epsilon)-(carboxymethyl)lysine adducts of proteins are ligands for receptor for advanced glycation end products that activate cell signaling pathways and modulate gene expression. J Biol Chem 1999;274:31740–31749 - PubMed
    1. Park L, Raman KG, Lee KJ, et al. Suppression of accelerated diabetic atherosclerosis by the soluble receptor for advanced glycation endproducts. Nat Med 1998;4:1025–1031 - PubMed
    1. Yamamoto Y, Kato I, Doi T, et al. Development and prevention of advanced diabetic nephropathy in RAGE-overexpressing mice. J Clin Invest 2001;108:261–268 - PMC - PubMed

Publication types

MeSH terms