

Total knee arthroplasty volume, utilization, and outcomes among Medicare beneficiaries, 1991-2010
- PMID: 23011713
- PMCID: PMC4169369
- DOI: 10.1001/2012.jama.11153
Total knee arthroplasty volume, utilization, and outcomes among Medicare beneficiaries, 1991-2010
Abstract
Context: Total knee arthroplasty (TKA) is one of the most common and costly surgical procedures performed in the United States.
Objective: To examine longitudinal trends in volume, utilization, and outcomes for primary and revision TKA between 1991 and 2010 in the US Medicare population.
Design, setting, and participants: Observational cohort of 3,271,851 patients (aged ≥65 years) who underwent primary TKA and 318 563 who underwent revision TKA identified in Medicare Part A data files.
Main outcome measures: We examined changes in primary and revision TKA volume, per capita utilization, hospital length of stay (LOS), readmission rates, and adverse outcomes.
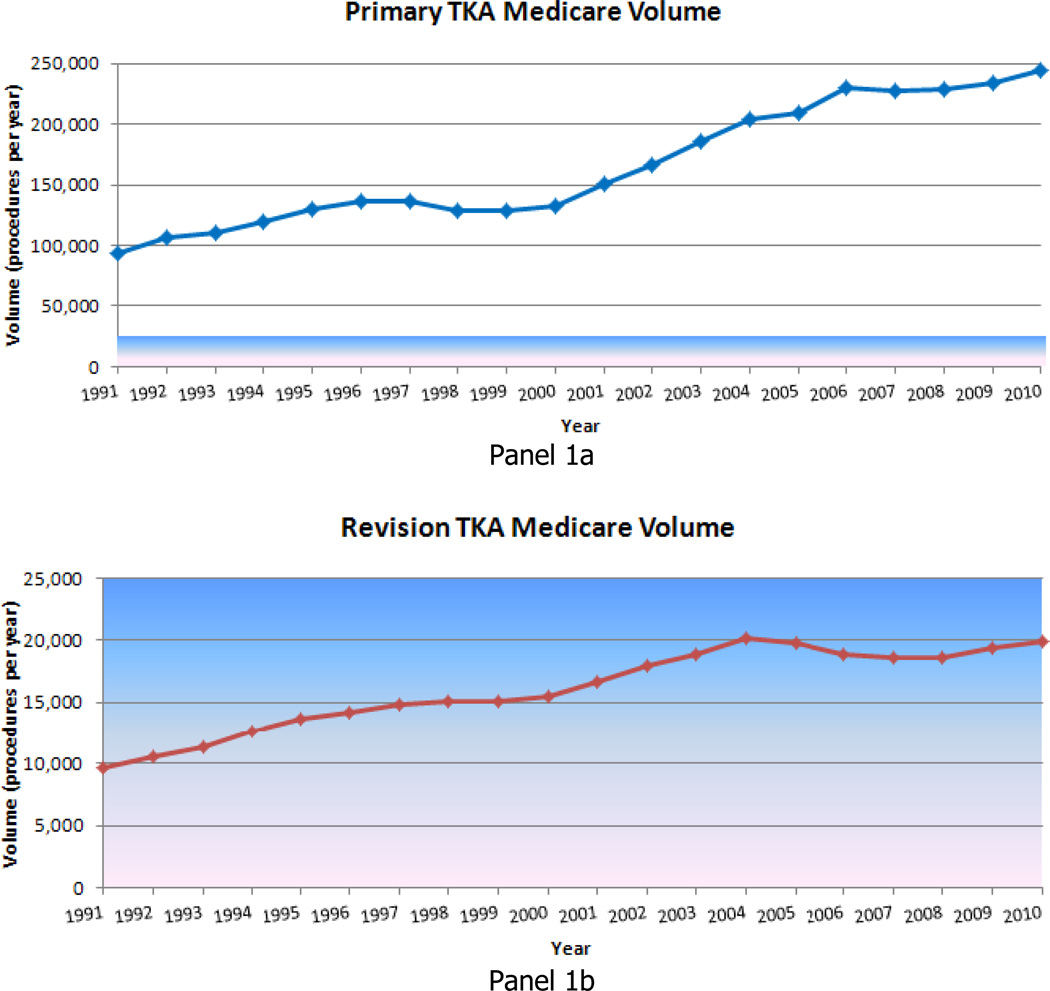
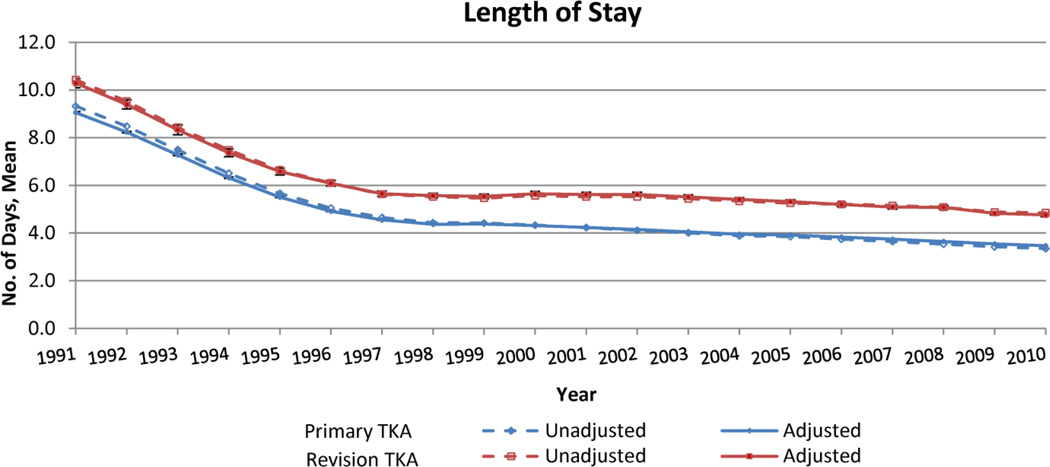
Results: Between 1991 and 2010 annual primary TKA volume increased 161.5% from 93,230 to 243,802 while per capita utilization increased 99.2% (from 31.2 procedures per 10,000 Medicare enrollees in 1991 to 62.1 procedures per 10,000 in 2010). Revision TKA volume increased 105.9% from 9650 to 19,871 while per capita utilization increased 59.4% (from 3.2 procedures per 10,000 Medicare enrollees in 1991 to 5.1 procedures per 10,000 in 2010). For primary TKA, LOS decreased from 7.9 days (95% CI, 7.8-7.9) in 1991-1994 to 3.5 days (95% CI, 3.5-3.5) in 2007-2010 (P < .001). For primary TKA, rates of adverse outcomes resulting in readmission remained stable between 1991-2010, but rates of all-cause 30-day readmission increased from 4.2% (95% CI, 4.1%-4.2%) to 5.0% (95% CI, 4.9%-5.0%) (P < .001). For revision TKA, the decrease in hospital LOS was accompanied by an increase in all-cause 30-day readmission from 6.1% (95% CI, 5.9%-6.4%) to 8.9% (95% CI, 8.7%-9.2%) (P < .001) and an increase in readmission for wound infection from 1.4% (95% CI, 1.3%-1.5%) to 3.0% (95% CI, 2.9%-3.1%) (P < .001).
Conclusions: Increases in TKA volume have been driven by both increases in the number of Medicare enrollees and in per capita utilization. We also observed decreases in hospital LOS that were accompanied by increases in hospital readmission rates.
Conflict of interest statement
Figures


Comment in
-
Increasing use of total knee replacement and revision surgery.JAMA. 2012 Sep 26;308(12):1266-8. doi: 10.1001/jama.2012.12644. JAMA. 2012. PMID: 23011717 No abstract available.
References
-
- Kurtz S, Mowat F, Ong K, Chan N, Lau E, Halpern M. Prevalence of primary and revision total hip and knee arthroplasty in the United States from 1990 through 2002. Journal of Bone and Joint Surgery. 2005 Jul;87(7):1487–1497. - PubMed
-
- Agency for Healthcare Research and Quality. 2007 HCUP Nationwide Inpatient Sample Comparison Report Report 2010-03. [Accessed November 13, 2011]; http://www.hcup-us.ahrq.gov/reports/methods/2010_03.pdf.
Publication types
MeSH terms
Grants and funding
LinkOut - more resources
Full Text Sources
Other Literature Sources
Medical
