. 2013 Feb;37(2):457-70.
doi: 10.1002/jmri.23823. Epub 2012 Sep 25.

Single-breath xenon polarization transfer contrast (SB-XTC): implementation and initial results in healthy humans

Affiliations

Single-breath xenon polarization transfer contrast (SB-XTC): implementation and initial results in healthy humans

Iga Muradyan et al. J Magn Reson Imaging. 2013 Feb.

Abstract

Purpose: To implement and characterize a single-breath xenon transfer contrast (SB-XTC) method to assess the fractional diffusive gas transport F in the lung: to study the dependence of F and its uniformity as a function of lung volume; to estimate local alveolar surface area per unit gas volume S(A)/V(Gas) from multiple diffusion time measurements of F; to evaluate the reproducibility of the measurements and the necessity of B(1) correction in cases of centric and sequential encoding.

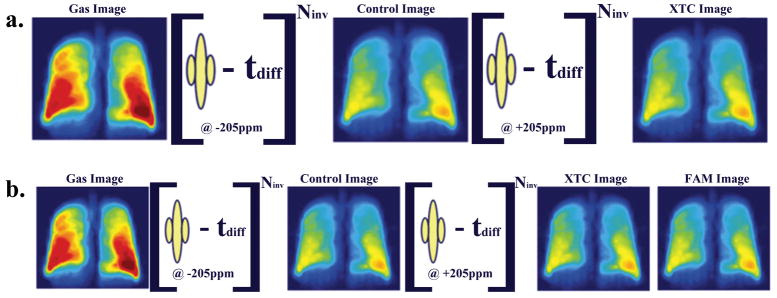
Materials and methods: In SB-XTC three or four gradient echo images separated by inversion/saturation pulses were collected during a breath-hold in eight healthy volunteers, allowing the mapping of F (thus S(A)/V(Gas)) and correction for other contributions such as T(1) relaxation, RF depletion and B(1) inhomogeneity from inherently registered data.

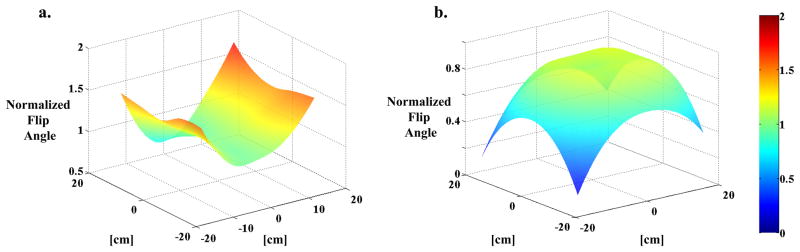
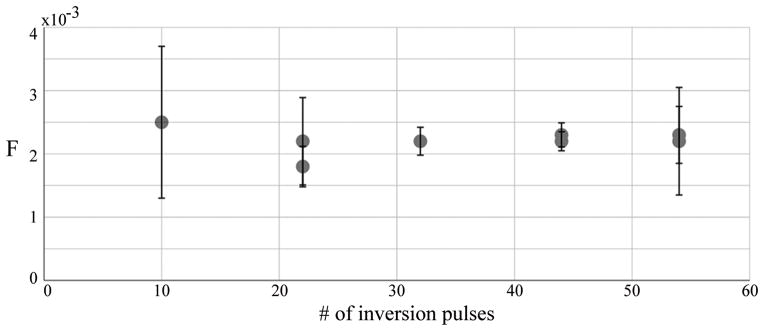
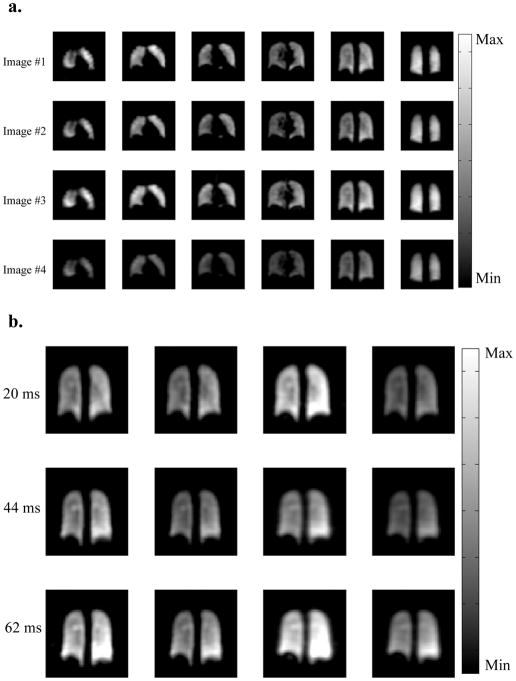
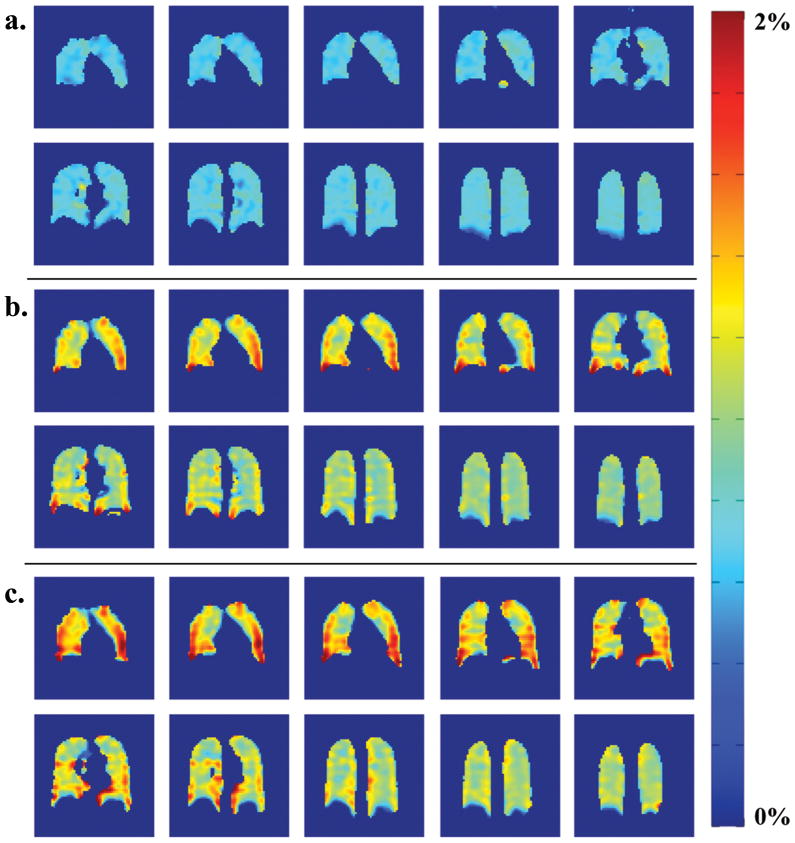
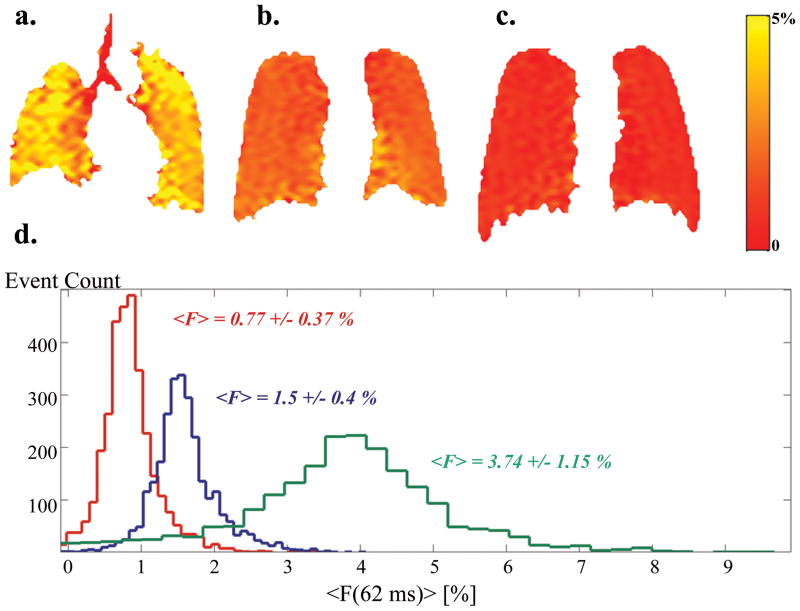
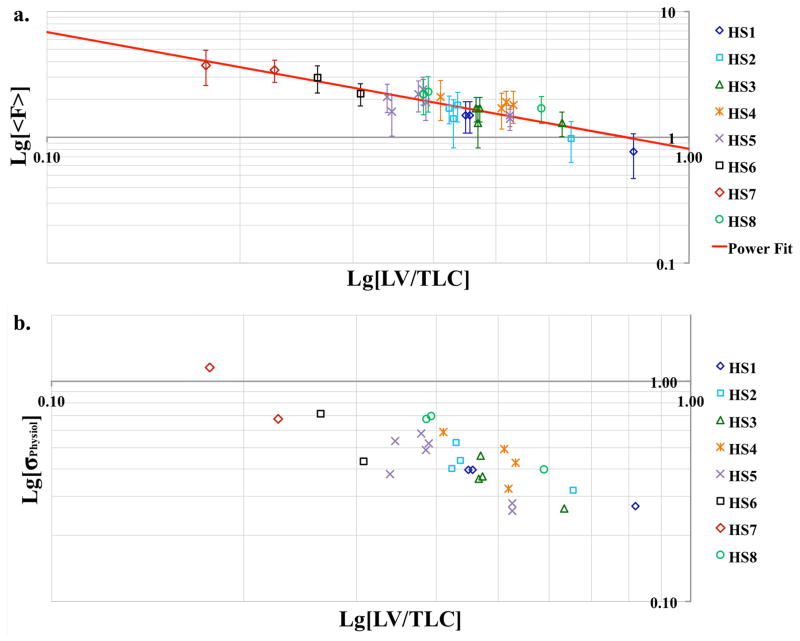
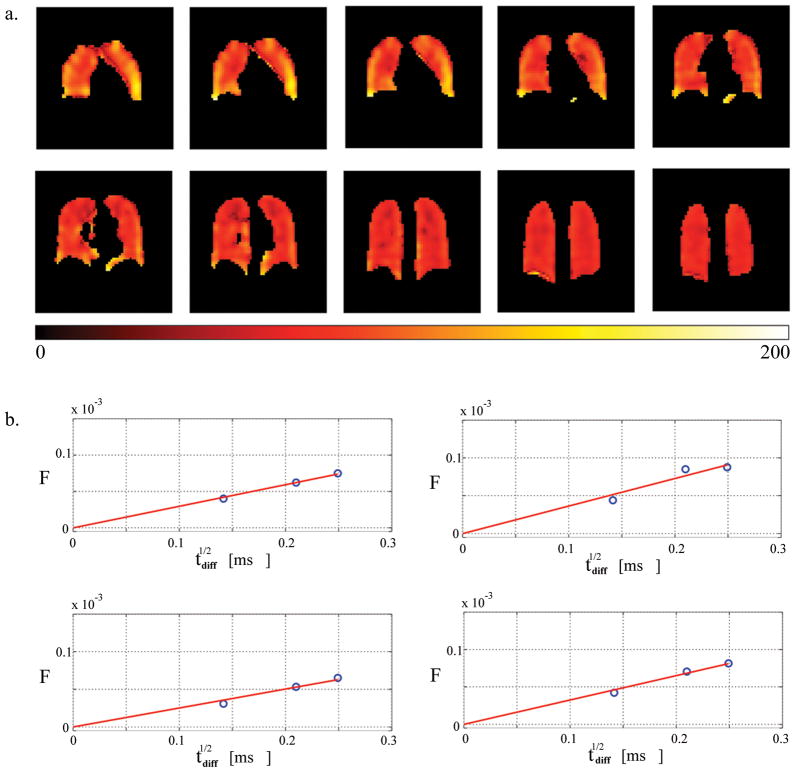
Results: Regional values of F and its distribution were obtained; both the mean value and heterogeneity of F increased with the decrease of lung volume. Higher values of F in the bases of the lungs in supine position were observed at lower volumes in all volunteers. Local S(A)/V(Gas) (with a mean ± standard deviation of S(A)/V(Gas) = 89 ± 30 cm(-1)) was estimated in vivo near functional residual capacity. Calibration of SB-XTC on phantoms highlighted the necessity for B(1) corrections when k-space is traversed sequentially; with centric ordering B(1) distribution correction is dispensable.

Conclusion: The SB-XTC technique is implemented and validated for in vivo measurements of local S(A)/V(Gas).


Figures

Figure 1
Figure 1
(a) At lower magnetic field three images are collected, where Gas and Control are separated by 180° pulses applied off-resonance, while the pulses between Control and XTC images are applied at dissolved state xenon frequency. The first two images are used for calibration purposes, and the last two provide 2D map of the fractional gas transport F. At 0.2T the loading of the coil did not change its Q significantly, allowing B1 calibrations be performed independently. (b) At higher magnetic fields the rf coils are sensitive to the load, making it essential to implement a B1 calibration routine for each run. We collected four 3D gradient echo images, the 1st pair of images are used as before for calibration of other attenuation sources, 2nd and 3rd images to estimate F, and last two to obtain the B1 distribution or Flip Angle Map (FAM). Performing all calibrations during the same breath-hold avoids image registration and lung volume control issues.
Figure 2
Figure 2
Flip Angle Maps. (a) FAM collected at 0.2T using a small spherical cell filled with hyperpolarized xenon gas. The data is interpolated to a larger matrix size to match the size of SB-XTC data matrix, and normalized to the flip angle setting used in the run. (b) FAM collected in vivo during a breath-hold as part of the SB-XTC experiment. The map is calculated using images #3 and 4, following the routine outlined in data analysis. Again, the values are normalized to the flip angle setting used in the run.
Figure 3
Figure 3
<F(t)> as a function of the number of inversion pulses. Based on these results, 44 inversion pulses were used in the studies.
Figure 4
Figure 4
Sample of 3D SB-XTC images collected at high field. (a) Data from the 20ms delay time run. Six out of twelve slices are presented to preserve space. Four images in each row correspond to Gas image (collected before the application of the saturation pulses), Control image (collected after the application of the saturation pulses at −205ppm), XTC image (collected after the application of the saturation pulses at +205ppm), and finally FAM image collected with the same flip angle as the XTC image. (b) A single slice data (from the four consecutive images) corresponding to three different delay times are presented for comparison. To minimize differences in the images, the subject remained inside the scanner between the experiments, while bags with gas mixture were prepared (~5min).
Figure 5
Figure 5
F-maps calculated for diffusion times of (a) 20ms, (b) 44ms and (c) 62ms. One curious feature of the data is the change in the gradient direction of the F values from anterior to posterior slices: in 20ms F-maps the anterior slices have lower F compared to posterior, as expected from gravitational dependence. However this gradient direction is reversed in 44 and 62ms F-maps. This could be explained by effect of different thickness contributions to F0 offset.
Figure 6
Figure 6
Fractional gas transport F(62ms) at three different lung volumes (VL) with corresponding histograms. Data presented here are from two subjects. (a) F-map at 18% TLC (near RV, HS7), mean value − <F> = 3.74%, σPhysiol = 1.15%; (b) F-map at 40% TLC (HS1), mean value − <F> = 1.5%, σPhysiol = 0.4%; (c) F-map at 80% TLC (HS1), mean value − <F> = 0.77%, σPhysiol = 0.37%. Note that although there is a substantial difference in the lung volumes at 18, 40 and 80% of TLC, it is hard to appreciate this volume difference in the maps: since these are maps based on 2D projection images, they are missing the thickness information of the lungs, thus present misleading feel of comparable lung volumes. The important message from this figure is in the color differences between the F-maps, as well as the color distribution in each of the maps. (d) histograms corresponding to the F-maps (green – 18% TLC (a), blue – 40% TLC (b), and red – 80% TLC (c)).
Figure 7
Figure 7
Lung volume dependence of the mean fractional gas transport <F> (a) and physiological heterogeneity σphysiol (b), both plotted on a Log-Log scale. All data are from 0.2T only. To enable intersubject comparison, the lung volumes are normalized to TLC of each subject. <F> from all subjects is in good agreement within the error, which is represented here by the contribution of the noise to the width of the fractional gas transport distribution. In most cases the largest contribution to the width of <F> distribution comes from the physiological heterogeneity.
Figure 8
Figure 8
(a) In all runs with healthy volunteers at lung volumes near FRC we observed positive gradient in Apex-to-Base direction. (b) As lung volumes increase approaching TLC the Apex-to-Base gradient disappears. Presented is a sample data from one of the subjects at two lung volumes: the red triangles correspond to higher lung volume while blue circles correspond to lower lung volume experiments.
Figure 9
Figure 9
(a) The S/V-map in units of inverse cm calculated from a pixel-wise linear model fit of F to √tdiff (see data analysis). The global mean value for S/V is 89±30 cm−1 (mean ± standard deviation). (b) Representative voxel-wise fits of F to the short-time model from four different voxels measured at three diffusion times.
Figure 10
Figure 10
Comparison of F obtained from images with centric (3T only) and sequential encoding of k-space. It is evident from the data that in the case of centrically encoded k-space, the B1 correction of the data does not significantly affect the value of F and might be omitted (circles in the plot). However, in the case of sequentially encoded k-space the implementation of the B1 correction (preferably during the same breathhold as in the case of four-image SB-XTC) might be necessary (squares and rhombi in the plot), even in the case of small variation in the flip angle (less than 10% variation in the flip angle over the FOV, 3T data).

References

    1. Bouchiat M, Carver T, Varnum C. Nuclear Polarization in 3He Gas Induced by Optical Pumping and Dipolar Exchange. Phys Rev Lett. 1960;5(8):373–375.
    1. Albert MS, Cates GD, Driehuys B, Happer W, Saam B, Springer CS, Wishnia A. Biological magnetic resonance imaging using laser-polarized 129Xe. Nature. 1994;370(6486):199–201. - PubMed
    1. Driehuys B, Cates aGD, Miron E, Sauer K, Walter DK, Happer W. High-volume production of laser-polarized 129Xe. Appl Phys Lett. 1996;69(12):1668–1670.
    1. Ruset I, Ketel S, Hersman F. Optical Pumping System Design for Large Production of Hyperpolarized 129Xe. Phys Rev Lett. 2006;96(5):53002. - PubMed
    1. Mugler JP, Driehuys B, Brookeman JR, Cates GD, Berr SS, Bryant RG, Daniel TM, de Lange EE, Downs JH, Erickson CJ, Happer W, Hinton DP, Kassel NF, Maier T, Phillips CD, Saam BT, Sauer KL, Wagshul ME. MR imaging and spectroscopy using hyperpolarized 129Xe gas: preliminary human results. Magn Reson Med. 1997;37(6):809–815. - PubMed

Publication types