. 2012 Oct 30;109(44):E2970-8.
doi: 10.1073/pnas.1211183109. Epub 2012 Sep 24.

Apo-intermediate in the transport cycle of lactose permease (LacY)

Affiliations

Apo-intermediate in the transport cycle of lactose permease (LacY)

M Gregor Madej et al. Proc Natl Acad Sci U S A. .

Abstract

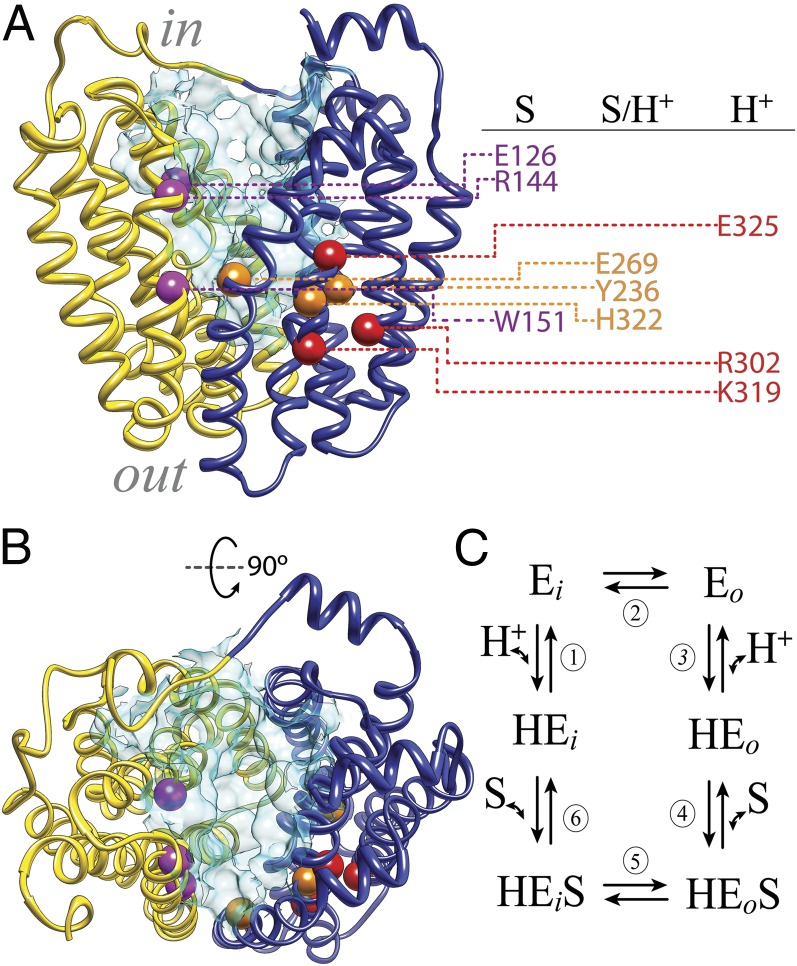
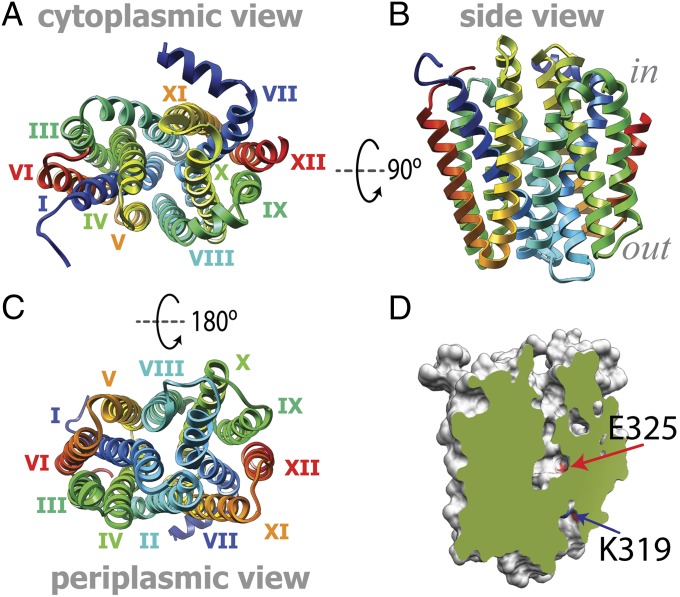
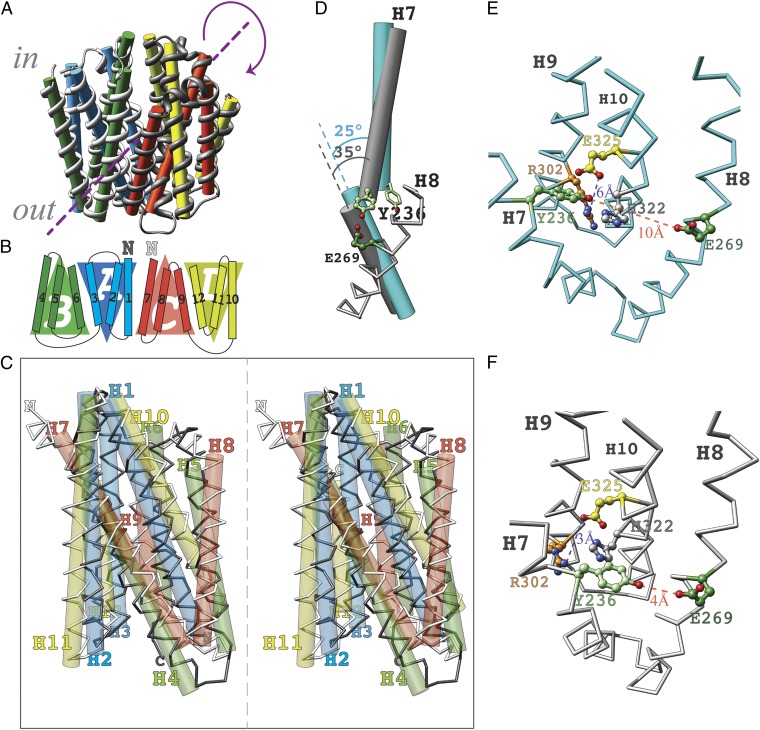
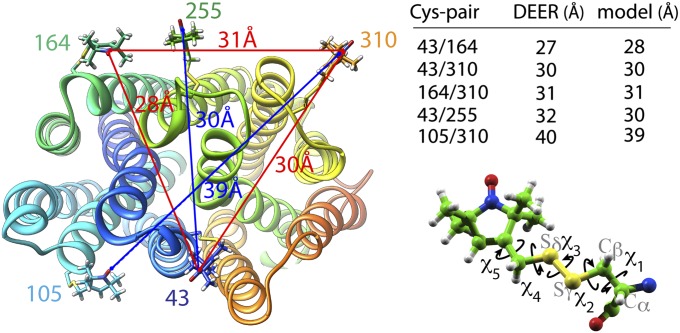
The lactose permease (LacY) catalyzes coupled stoichiometric symport of a galactoside and an H(+). Crystal structures reveal 12, mostly irregular, transmembrane α-helices surrounding a cavity with sugar- and H(+)- binding sites at the apex, which is accessible from the cytoplasm and sealed on the periplasmic side (an inward-facing conformer). An outward-facing model has also been proposed based on biochemical and spectroscopic measurements, as well as the X-ray structure of a related symporter. Converging lines of evidence demonstrate that LacY functions by an alternating access mechanism. Here, we generate a model for an apo-intermediate of LacY based on crystallographic coordinates of LacY and the oligopeptide/H(+) symporter. The model exhibits a conformation with an occluded cavity inaccessible from either side of the membrane. Furthermore, kinetic considerations and double electron-electron resonance measurements suggest that another occluded conformer with bound sugar exists during turnover. An energy profile for symport is also presented.


Conflict of interest statement

The authors declare no conflict of interest.

Figures

Fig. 1.
Fig. 1.
LacY structure. (A) Side view of the inward-facing conformation of LacY (PDB ID code 2V8N). The N-terminal six-helix bundle is colored yellow, and the C-terminal six-helix bundle is colored dark blue. The cytoplasmic side (in) and the periplasmic side (out) are shown. The spheres represent Cα atoms of critical residues (magenta, residues involved in sugar binding exclusively; orange, residues involved in sugar affinity and H+ translocation; red, residues involved in H+ translocation exclusively; details are provided in the main text). The water-accessible surface of the cavity is shown in light blue (surface was calculated using the Computed Atlas of Surface Topography of proteins (CASTp) Web tool with a probe size of 1.4 Å). (B) Cytoplasmic view; the color coding is as in A. (C) Six-step kinetic model for lactose/H+ symport. Steps are numbered consecutively: (1) deprotonation of inward-facing conformer (HEi) resulting in the unprotonated inward-facing conformation (Ei), (2) conformational change allowing the galactoside- and H+-binding sites to become accessible to the periplasmic side of the membrane (Eo), (3) protonation of LacY yielding the protonated and outward-facing conformer (HEo), (4) substrate binding and formation of the sugar-bound protonated and outward-facing conformer (HEoS), (5) global conformational change in which the protonated LacY with bound sugar returns to the initial inward-facing conformation (HEiS), and (6) dissociation of sugar.
Fig. 2.
Fig. 2.
Predicted tertiary structure model for the apo-intermediate. (A) Cytoplasmic view; the helices are numbered with roman numerals. (B) Side view; the color coding is as in A. (C) Periplasmic view; the color coding is as in A. (D) Slab view of the cavities in the apo-intermediate. The molecule surface is colored gray, and the exposed surface is colored green. The contact surfaces of residues K319 and E325, as indicated by the arrows (blue and red, respectively), are colored according to the heteroatom (red, oxygen; blue, nitrogen).
Fig. 3.
Fig. 3.
Structural characteristics of the apo-intermediate. (A) Symmetry. The symmetry axis (broken line) is parallel to the membrane. (B) Schematic of the transmembrane topology of LacY emphasizes structural relationships between the four triple-helix topology segments. The N termini of the first (H1–H6) and second (H7–H12) six-helix bundles are indicated with a dark “N” and a light “N”, respectively. (C) Structural alignment of the N-terminal and C-terminal six-helix bundles (stereoview). (D) Kink in helix 7. The helix-vectors of the N- and C-terminal parts of helix 7 are shown as rods, in cyan for the X-ray structure and in gray for the apo-intermediate model. Their crossing angels are indicated. Residue Y236 (pale green) is shown in two positions: as a stick model in the X-ray structure and as balls and sticks in the apo-intermediate model. For orientation, the chain trace of H8 in the apo-intermediate is shown in gray with the residue E269 (dark green). (E) Cytoplasmic view of the components of the H+ translocation site according to the X-ray structure of the inward-facing conformation (PDB ID code 2V8N). The side chains are colored as follows: light green, Y236; dark green, E269; orange, R302; gray, H322; and yellow, E325. Oxygen and nitrogen atoms are colored red and blue, respectively. (F) Cytoplasmic view of the H+ translocation site in the apo-intermediate model. Side chains are colored the same as in E.
Fig. 4.
Fig. 4.
Distance trilateration. Nitroxide labels attached to paired Cys replacements are modeled on the proposed apo-intermediate and optimized for clashes with the protein surface (Left). Conformational space was explored by varying the χ-angle (Lower Right) to find conformations of nitroxide side chains that satisfy DEER distances between three residues (Upper Right) [i.e., residues 43–164, 164–310, and 43–310, indicated with red lines (Left)] as described in Experimental Procedures. The next residue (i.e., residue 255) was modeled, and the next trilateration set is optimized in agreement with the DEER data. The distances are taken from a study by Smirnova et al. (18) and SI Appendix, Table S2.
Fig. 5.
Fig. 5.
Interspin distance distributions detected with nitroxide-labeled cytoplasmic Cys pair 73/340 (indicated by yellow stars) on WT LacY (A and B) or mutant C154G (C and D). Distance distributions obtained by Tikhonov regularization of dipolar spectra are shown (A and C, solid blue line with no bound sugar; B and D, solid red line with bound sugar). Relative distributions of conformational populations are obtained by multi-Gaussian deconvolution [details are provided in the study by Smirnova et al. (18)]. Peak centers, indicated on top of the Gaussian peaks, represent the distance between the nitroxides at these positions (interspin distance). The interspin distances are attributed to a distinct conformation (shown on top: blue, outward-facing; gray, occluded-intermediate; orange, apo-intermediate; green, inward-facing). The relative area of the respective Gaussian peaks is indicated (%) and represents the fraction of each conformational population in the multi-Gaussian fit (broken black line). The distance differences between the peak centers represent distance changes between these positions in different conformations and are indicated as horizontal bars. The numbers in parentheses are the distance differences between Cα atoms in the structure models of the respective conformations.
Fig. 6.
Fig. 6.
Interspin distance distributions detected with nitroxide-labeled periplasmic Cys pair 164/310 (indicated by yellow stars) on WT LacY (A and B) or mutant C154G (C and D). Distance distributions obtained by Tikhonov regularization of dipolar spectra are shown (A and C, solid blue line with no bound sugar; B and D, solid red line with bound sugar). Relative distributions of conformational populations are obtained by multi-Gaussian deconvolution [details are provided in the study by Smirnova et al. (18)]. Peak centers, indicated on top of the Gaussian peaks, represent the distance between the nitroxides at these positions (interspin distance). The interspin distances are attributed to a distinct conformation (shown above: blue, outward-facing; gray, occluded-intermediate; orange, apo-intermediate; green, inward-facing; white, unassigned). The relative area of the respective Gaussian peaks is indicated (%) and represents the fraction of each conformational population in the multi-Gaussian fit (dashed black line). The distance differences between the peak centers represent distance changes between these positions in different conformations and are indicated as horizontal bars. The numbers in parentheses are the distance differences between Cα atoms in the structure models of the respective conformation.
Fig. 7.
Fig. 7.
Effect of sugar binding on fraction distribution of apo-intermediate and occluded-intermediate. Vertical bars represent the relative fraction of conformational population calculated from multi-Gaussian deconvolution of distributions obtained by Tikhonov regularization [details are provided in the study by Smirnova et al. (18)]. Results attributed to the occluded-intermediate (A) and apo-intermediate (B) with no sugar bound (black bars) or in the presence of a saturating concentration of NPGal (gray bars) are compared. Periplasmic Cys pairs (Left) and cytoplasmic Cys pairs (Right) are shown. The peak center distances (expressed in angstroms) assigned to the respective conformations are indicated above the data pairs.
Fig. 8.
Fig. 8.
Transport cycle of LacY. (A) Overview of the postulated steps in the transport model. Inward-facing (green) and outward-facing (blue) conformations are separated by the apo-intermediate conformational cluster (orange) or by the occluded-intermediate conformational cluster (gray). Steps are numbered consecutively: (1) conformational transition allowing the deprotonation of Glu325; (2) formation of the deprotonated apo-intermediate; (3) reprotonation of LacY and opening of the periplasmic cavity; (4 and 5) reorientation of helices, where LacY passes through a low-energy conformation (details are provided in the main text); (6) binding of sugar and induced fit to the occluded-intermediate; (7) opening of the cytoplasmic cavity and release of sugar; and (8) conformational transition to inward-facing conformation. All steps are reversible (indicated by double-headed arrows). (B) Hypothetical energy profile for the transport cycle. Conformational states in A are translated into relative energy states (indicated by the icons of conformations defined in A with the cytoplasmic side of LacY facing up) based on their occurrence as a conformational fraction in interspin distance distribution. The scheme can be read in cycle following the arrowheads. The red line represents the transition between steps 1 and 4 for opening of the empty carrier to the outward-facing conformation. The blue line corresponds to steps 5–8 for sugar transport from outside to inside (and to the exchange reaction when steps 5–8 operate in a reverse manner). The free energy of the putative rate-determining step in absence of Δμ̃H+ (opening of the periplasmic cavity) is indicated by the vertical red arrow (ΔGn*). The hypothetical effect of an imposed Δμ̃H+ is shown as a dashed black vertical arrow, and the resulting energy profile is shown by the dashed red lines. The energy of sugar binding on the periplasmic (ΔG*6) and cytoplasmic (ΔG*−7) sides is suggested to be equivalent from either side of the membrane (indicated by the vertical blue arrows).
Fig. P1.
Fig. P1.
Transport cycle of LacY. (A) Distance trilateration. Nitroxide labels are attached to paired Cys-replacements on the proposed apo-intermediate. The trilaterated interspin distances are shown as red lines. (B) Interspin distance distributions detected with nitroxide-labeled periplasmic Cys-pair 164/310 (indicated by yellow stars) on WT LacY (Upper, with no bound sugar; Lower, with bound sugar). Peak centers represent the distance between the nitroxides (interspin distance). The interspin distances are attributed to a distinct conformation (shown on top: blue, outward-facing; gray, occluded-intermediate; orange, apo-intermediate; green, inward-facing). The relative area of the respective Gaussian peaks is indicated (%) and corresponds to the conformational fraction. NPGal, 4-nitrophenyl-α-d-galactopyranoside; NPGlu, 4-nitrophenyl-α-d-glucopyranoside. (C) Hypothetical energy profile for the transport cycle. The energy levels of the postulated conformations are assigned based on their occurrence as a conformational fraction in interspin distance distribution (i.e., B). The scheme can be read in cycle following the arrowheads. The red line represents the transition between steps 1 and 4 for opening of the empty permease to the outward-facing conformation. The blue line corresponds to steps 5–8 for sugar transport from outside to inside. The vertical red arrow (ΔGn*) indicates the free energy of the rate-determining step in the absence of H+ (opening of the periplasmic cavity). The hypothetical effect of an imposed H+ is shown as a black, broken inverted vertical arrow, and the resulting energy profile is shown by the discontinuous red line.

Similar articles

Cited by

References

    1. Saier MH., Jr Families of transmembrane sugar transport proteins. Mol Microbiol. 2000;35:699–710. - PubMed
    1. Saier MH, Jr, et al. The major facilitator superfamily. J Mol Microbiol Biotechnol. 1999;1:257–279. - PubMed
    1. West IC. Lactose transport coupled to proton movements in Escherichia coli. Biochem Biophys Res Commun. 1970;41:655–661. - PubMed
    1. West IC, Mitchell P. Stoicheiometry of lactose-H+ symport across the plasma membrane of Escherichia coli. Biochem J. 1973;132:587–592. - PMC - PubMed
    1. Patel L, Garcia ML, Kaback HR. Direct measurement of lactose/proton symport in Escherichia coli membrane vesicles: Further evidence for the involvement of histidine residue(s) Biochemistry. 1982;21:5805–5810. - PubMed

Publication types

MeSH terms

Substances

LinkOut - more resources