. 2012 Oct 9;109(41):E2832-41.
doi: 10.1073/pnas.1206557109. Epub 2012 Sep 24.

Nucleus basalis-enabled stimulus-specific plasticity in the visual cortex is mediated by astrocytes

Affiliations

Nucleus basalis-enabled stimulus-specific plasticity in the visual cortex is mediated by astrocytes

Naiyan Chen et al. Proc Natl Acad Sci U S A. .

Abstract

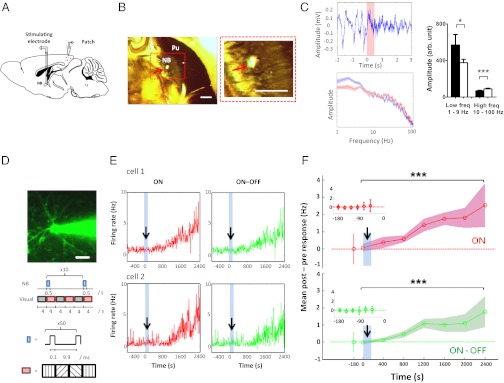
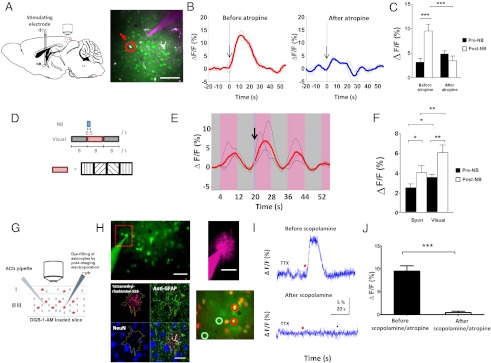
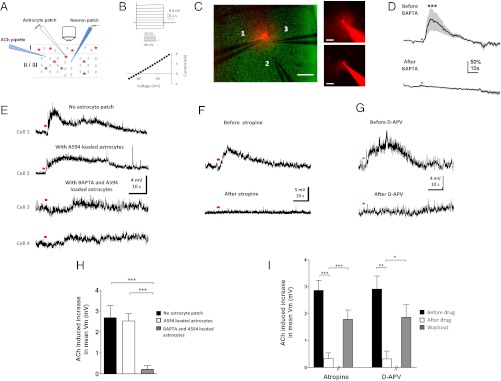
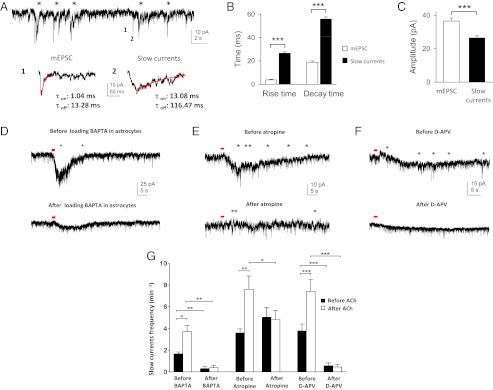
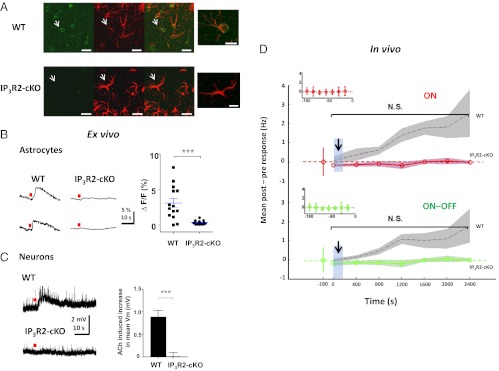
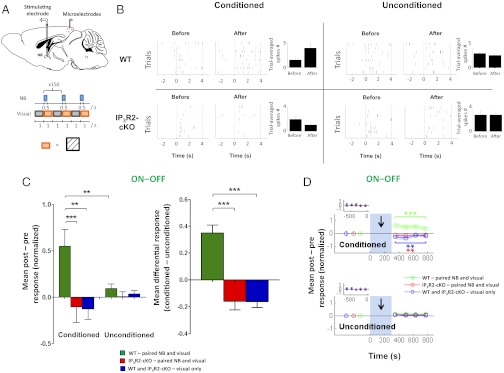
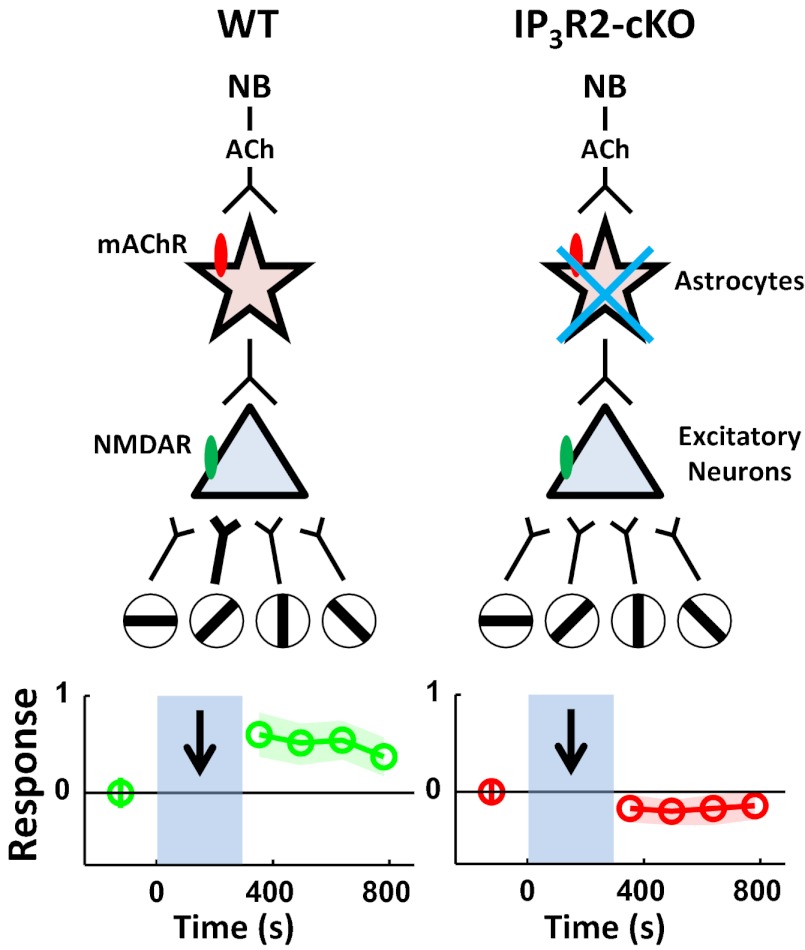
Although cholinergic innervation of the cortex by the nucleus basalis (NB) is known to modulate cortical neuronal responses and instruct cortical plasticity, little is known about the underlying cellular mechanisms. Using cell-attached recordings in vivo, we demonstrate that electrical stimulation of the NB, paired with visual stimulation, can induce significant potentiation of visual responses in excitatory neurons of the primary visual cortex in mice. We further show with in vivo two-photon calcium imaging, ex vivo calcium imaging, and whole-cell recordings that this pairing-induced potentiation is mediated by direct cholinergic activation of primary visual cortex astrocytes via muscarinic AChRs. The potentiation is absent in conditional inositol 1,4,5 trisphosphate receptor type 2 KO mice, which lack astrocyte calcium activation, and is stimulus-specific, because pairing NB stimulation with a specific visual orientation reveals a highly selective potentiation of responses to the paired orientation compared with unpaired orientations. Collectively, these findings reveal a unique and surprising role for astrocytes in NB-induced stimulus-specific plasticity in the cerebral cortex.


Conflict of interest statement

The authors declare no conflict of interest.

Figures

Fig. 1.
Fig. 1.
Paired NB and visual stimulation potentiates visual responses in excitatory neurons in vivo. (A) Schematic illustration of cell-attached recordings from V1 neurons during paired NB and visual stimulation (50). (B) (Left) Localization of the stimulation electrode tract in the NB (red arrow), revealed by acetylcholinesterase histochemistry. Pu, putamen. (Right) Magnified view of the red box. (Scale bars, 500 μm.) (C) (Upper Left) Desynchronization of the interhemispheric EEG signal after NB stimulation at t = 0 s (pink bar). (Lower Left) Amplitude-frequency graph 1 s before (blue) and after (red) NB stimulation, averaged over 10 trials. (Right) NB stimulation induces a decrease in the amplitude of low-frequency events (n = 9 datasets; *P < 0.05, paired t test) and an increase in high-frequency events (n = 91 datasets; ***P < 0.0001, paired t test), respectively. EEG desynchronization and/or acetylcholinesterase histochemistry was used to verify NB electrode placement in every experiment. (D) (Upper) Pyramidal neuron electroporated with green Alexa 488 dye by a glass pipette that forms a loose seal with it. (Scale bar, 20 μm.) (Lower) Schematic illustration of the paired NB and visual stimulation protocol. A visual stimulus (random orientation gratings, pink) was alternately presented with a blank gray screen (gray). NB trains (blue) were synchronized with the onset of each visual stimulus for 10 trials. (E) Examples of neurons that show potentiation of ON and ON–OFF responses with paired NB and visual protocol (blue shades with arrow). (F) Mean post-NB minus pre-NB response changes (firing rate, Hz) show potentiation of ON and ON–OFF visual responses in a population of neurons (n = 6 neurons in 6 animals; ***P << 0.001, paired t test comparing pre-NB with post-NB responses pooled across all 400-s time segments for both ON and ON–OFF responses). Blue-shaded bars with an arrow indicate the NB stimulation period. Color shades around means indicate SEM. (Insets) Stable baseline responses before NB stimulation. The x-axis labels indicate the start of the time segment analyzed.
Fig. 2.
Fig. 2.
In vivo NB stimulation and ex vivo ACh application directly induce robust calcium responses in visual cortical astrocytes via muscarinic receptors. (A) (Left) Schematic illustration of the experimental setup for two-photon calcium imaging during NB stimulation. (Right) Labeling of cortical astrocytes with OGB1-AM (green) and SR-101 (red) with a micropipette for pressure injection of atropine plus A594 to visualize drug spread. An astrocyte used in the analysis is circled in red. (Scale bar, 50 μm.) (B) Responses of astrocytes to brief NB stimulation (arrow) before and after the application of atropine. Black lines show examples of trial-averaged single-cell responses computed from three NB stimulation repeats; red and blue lines are means of the single-cell responses. (C) Population averages of NB stimulation-induced calcium responses in astrocytes before and after atropine application. Shown are responses of cells with trial-averaged post-NB responses greater than pre-NB responses (astrocytes: 17 of 26, n = 3 animals). ***P < 0.001. (D) Schematic illustration of the paired NB and visual stimulation protocol used. The random orientation grating stimulus (pink) was alternately presented with a blank gray screen (gray) across multiple cycles. A single brief train of NB pulses was synchronized with the onset of one visual stimulus cycle. (E) NB stimulation (arrow) facilitates visual responses in astrocytes. Pink/gray bars indicate time segments when a visual stimulus and a blank gray screen, respectively, were presented. Black and red lines are computed similarly as those in B. (F) Population average of NB stimulation-induced calcium responses in astrocytes before and after visual stimulation. Shown are 47 of 63 cells (5 animals) with significant visual responses (*P < 0.05, paired t test comparing pre-NB responses before and after visual stimulation). *P < 0.05; **P < 0.01 by paired t test. (G) Schematic illustration of experimental setup for calcium imaging of OGB1-AM–loaded layer 2/3 astrocytes in V1 slices. ACh was pressure-ejected locally, and electroporated astrocytes were identified by immunohistochemistry (SI Materials and Methods, Immunohistochemistry). (H) (Upper Left) Fluorescence image of OGB1-AM–loaded astrocytes and neurons shows an electroporation pipette. (Scale bar, 50 μm.) (Upper Right) Tetramethylrhodamine-555 (T-555) dye-filled astrocyte. (Scale bar, 25 μm.) (Lower Left) That astrocyte is demarcated in yellow by extent of T-555, which colocalizes with anti-GFAP but not with neuronal nuclei (NeuN) immunohistochemistry. (Scale bar, 25 μm.) (Lower Right) Merged SR101 (red) and OGB1-AM (green) fluorescence images obtained during simultaneous calcium imaging of OGB1-AM–loaded astrocytes (circled red) and neurons (circled green), where the former is colabeled with SR101. (Scale bar, 50 μm.) (I) ACh (red dot; 50 mM, 0.2–1 s, 20 psi) induces TTX-insensitive calcium transients in astrocytes, which are abolished by the mAChR antagonist scopolamine (20 μM). (J) Population average of ACh-induced calcium responses in astrocytes before/after mAChR antagonists. Responses to scopolamine and atropine are similar and pooled (scopolamine, n = 6 astrocytes; atropine, n = 2 astrocytes; ***P = 0.0001, paired t test; n = 4 slices in 3 animals). Error bars indicate SEM. ΔF/F, time-lapse change in fluorescence normalized by the baseline fluorescence.
Fig. 3.
Fig. 3.
Cholinergic activation of astrocytes contributes to prolonged depolarizing responses in excitatory neurons ex vivo. (A) Schematic illustration of slice experimental setup. Calcium responses of layer 2/3 V1 astrocytes were imaged after ACh application (10 mM, 200 ms, 20 psi, unless indicated otherwise), before/after being loaded with A594 and/or calcium chelator BAPTA by whole-cell patch-clamp. Neurons were patched immediately after A594 and/or BAPTA dialysis within astrocyte syncytium. (B) Electrophysiological characteristics of an astrocyte, with the I-V curve showing negative resting basal membrane potential (Vm) and absence of active membrane currents. (C) (Left) Relative positions of an astrocyte patch pipette (1), ACh pipette (2), and neuronal patch pipette (3) as indicated. (Scale bar, 100 μm.) The range of spacing between ACh and patch pipettes in all experiments was 20–100 μm. (Right) Spread of A594 (and BAPTA) in the syncytium (Lower) within 30–45 min of patching an astrocyte identified by its small round soma with thin radiating processes (Upper). (Scale bars: Lower, 100 μm; Upper, 25 μm.) (D) Population-averaged calcium responses in astrocytes to ACh application (red dot, 1 s, 20 psi) (n = 35 astrocytes in 4 animals) before and after BAPTA loading (50 mM). ***P << 0.001, paired t test comparing population-averaged responses during 10-s post-ACh application before and after BAPTA loading. SEM is represented by shading about the mean. (E) Compared with control responses from patch-clamped excitatory neurons recorded without an astrocyte patch (cell 1) and with A594 loading of the astrocyte syncytium (cell 2), the amplitude of ACh-induced slow depolarization is reduced in excitatory neurons after BAPTA/A594 dialysis of adjacent astrocytes (cells 3 and 4). (F and G) Bath application of atropine (10–100 μM) and d-APV (50 μM) drastically reduced the slow depolarization amplitude. (H) Population average of ACh-induced increase in mean Vm of (i) neurons patched without loading astrocytes (n = 9, randomly sampled without replacement from a large pool of 50 neurons), (ii) neurons patched after loading astrocytes with A594 (n = 9 neurons and n = 4 astrocytes in 4 animals), and (iii) neurons patched after loading astrocytes with BAPTA and A594 (n = 9 neurons and n = 8 astrocytes in 6 animals). P > 0.8; P < 0.001; P < 0.0001 by t test comparing (i) and (ii), (i) and (iii), and (ii) and (iii), respectively. (I) Population average of ACh-induced increase in mean Vm of neurons before/after bath application and washout of atropine (n = 18 and n = 8 of 18 with washout in 13 animals) and d-APV (n = 8 and n = 4 of 8 with washout in 8 animals). The ACh-induced increase in mean Vm was calculated as the difference between mean Vm during 15-s pre-ACh and post-ACh application. *P < 0.05; **P < 0.01; ***P < 0.001 by paired t test comparing before/after drug and t test comparing after drug/washout. Error bars indicate SEM.
Fig. 4.
Fig. 4.
Cholinergic activation of astrocytes contributes to an increase in TTX-insensitive slow currents in excitatory neurons via calcium-mediated processes that act on neuronal NMDARs. (A) Whole-cell neuronal recording in which slow currents (labeled with asterisks) were discriminated from miniature excitatory postsynaptic currents (mEPSCs) based on their time course. (Lower) Expanded trace shows the amplitude and time course of (1) a mEPSC and (2) a slow-current event. τon and τoff, time constants of activation and deactivation (delineated by the red traces). (B) Comparison of the mean rise and decay times between mEPSCs and slow currents (rise and decay times: ***P << 0.001, t test). (C) Comparison of the mean amplitudes between mEPSCs and slow currents (***P << 0.001, t test). B and C were computed from 75 events in 15 neurons. Error bars indicate SEM. (DF) ACh (red dot, 10 mM, 200 ms, 20 psi) induces an increase in the frequency of TTX-insensitive slow currents (labeled with asterisks) in a neuron (Upper), which is reduced after (D, Lower) BAPTA dialysis of astrocytes, (E, Lower) bath application of atropine (50 μM), and (F, Lower) bath application of d-APV (50 μM). In D, unlike in Fig. 3, neurons were patched first and their cholinergic responses were assessed before and after BAPTA dialysis of astrocytes. (G) Population average of TTX-insensitive slow currents before and after ACh application in the following conditions: before/after BAPTA dialysis, before/after atropine, and before/after d-APV. *P < 0.05; **P < 0.01; *** P < 0.001 by paired t test. Error bars indicate SEM.
Fig. 5.
Fig. 5.
Deletion of astrocyte IP3R2 receptors abolishes ACh-induced depolarizing responses in excitatory neurons ex vivo and NB-induced potentiation of visual responses in vivo. (A) Immunohistochemical staining of layer 2/3 cortical astrocytes in WT animals (Upper) and IP3R2-cKO animals (Lower) (2 animals each), with anti-IP3R2 (Left) and anti-GFAP (Center), and showing colocalization of IP3R2 on astrocytes in WT but not in IP3R2-cKO animals due to highly reduced IP3R2 staining in the latter (Right). (Scale bar, 20 μm.) (Far Right) Image shows a magnified image of the astrocyte marked by arrow in the previous images. (Scale bar: 10 μm.) (B) (Left) Local ACh application (red dot) evokes calcium responses in astrocytes in WT but not in IP3R2-cKO adult slices. (Right) Magnitude of astrocyte calcium responses in WT (n = 14 astrocytes in 2 animals) and IP3R2-cKO (n = 24 astrocytes in 2 animals). ***P < 0.0001, t test. (C) (Left) Local ACh application (red dot) evokes prolonged depolarizing responses in neurons in WT but not in IP3R2-cKO adult slices. (Right) Population average of ACh-induced increase in mean basal membrane potential (Vm) of neurons in WT (n = 5 neurons in 2 animals) and IP3R2-cKO (n = 5 neurons in 2 animals). ***P < 0.001, t test. (D) Mean post-NB minus pre-NB response changes (firing rate, Hz) in IP3R2-cKO animals (red and green traces), following multiple pairings of NB stimulation trains with visual stimuli (identical to Fig. 1D), show absence of facilitation of visual responses (n = 5 neurons in 4 adult animals; P > 0.1, paired t test comparing pre-NB responses with post-NB responses pooled across all 400-s time segments for both ON and ON–OFF responses). Black dotted traces with gray shades are WT responses from Fig. 1F. Blue-shaded bars with an arrow indicate the NB stimulation period. Color shades around means indicate SEM. (Insets) Stable baseline responses before NB stimulation. N.S., nonsignificant.
Fig. 6.
Fig. 6.
Cholinergic activation of astrocytes contributes to stimulus-specific potentiation. (A) Schematic illustration of single-unit recordings from V1 neurons (Upper) and the protocol used during paired NB and visual stimulation (Lower). A visual grating of arbitrary orientation (orange) was alternately presented with a blank gray screen (gray); NB stimulation was synchronized with the onset of the visual stimulus for 150 trials. (B) Raster plots show examples of neuronal responses from a WT animal and an IP3R2-cKO animal to a conditioned orientation (Left) and an unconditioned orientation (Right) before and after the pairing protocol. Presentation of the conditioned orientation is indicated by dotted red lines (0–4 s). Trial-averaged number of spikes for the example neurons (Left) is shown in bar graphs (Right). (C) (Left) Population mean of normalized post-NB minus pre-NB responses (ON–OFF) at conditioned and unconditioned orientations in WT and IP3R2-cKO animals under different protocols. Control (visual-only) responses in WT and IP3R2-cKO animals were similar (Fig. S8E) and are pooled for clarity (SI Materials and Methods, Single-Unit Recording and Table S2, statistical comparisons). **P < 0.01, Wilcoxon rank-sum text. (Right) Mean differential responses (conditioned − unconditioned orientations). ***P < 0.0001, Wilcoxon rank-sum test. Error bars indicate SEM. WT (n = 5 animals): paired, n = 41 neurons; visual-only, n = 24 neurons. IP3R2-cKO (n = 4 animals): paired, n = 45 neurons; visual-only, n = 21 neurons. (D) Time course of mean normalized post-NB minus pre-NB responses (ON–OFF) at conditioned (Upper) and unconditioned (Lower) orientations. Blue-shaded bars with an arrow indicate the NB stimulation period. (Insets) Pre-NB baseline responses were averaged over four trials and are shown. Postpairing responses at the conditioned orientation were significantly enhanced in WT animals (green). Responses were suppressed in the visual-only condition (blue; P < 0.01) and in IP3R2-cKO animals after pairing (red; P < 0.01). **P < 0.01; ***P < 0.001 by Wilcoxon rank-sum test comparing responses before and after NB pairing.
Fig. P1.
Fig. P1.
Schematic illustrates the suggested mechanisms underlying NB-enabled, stimulus-specific plasticity in the visual cortex. (Left) In wild-type (WT) animals, paired NB and specific visual orientation stimulation induces NMDA receptor (NMDAR, green oval) mediated potentiation of responses to the paired orientation through cholinergic activation of astrocytes via muscarinic ACh receptors (mAChR, red oval). (Right) Plasticity is absent in conditional IP3R2 KO (IP3R2-cKO) animals with impaired IP3R2-mediated astrocytic calcium increase. Open circles with oriented bars indicate different visual stimuli.

References

    1. Kitt CA, Höhmann C, Coyle JT, Price DL. Cholinergic innervation of mouse forebrain structures. J Comp Neurol. 1994;341:117–129. - PubMed
    1. Bakin JS, Weinberger NM. Induction of a physiological memory in the cerebral cortex by stimulation of the nucleus basalis. Proc Natl Acad Sci USA. 1996;93:11219–11224. - PMC - PubMed
    1. Kilgard MP, Merzenich MM. Cortical map reorganization enabled by nucleus basalis activity. Science. 1998;279:1714–1718. - PubMed
    1. Puckett AC, Pandya PK, Moucha R, Dai W, Kilgard MP. Plasticity in the rat posterior auditory field following nucleus basalis stimulation. J Neurophysiol. 2007;98:253–265. - PubMed
    1. Bao S, Chang EF, Davis JD, Gobeske KT, Merzenich MM. Progressive degradation and subsequent refinement of acoustic representations in the adult auditory cortex. J Neurosci. 2003;23:10765–10775. - PMC - PubMed

Publication types

MeSH terms

LinkOut - more resources