. 2012 Nov 13;109(46):18891-6.
doi: 10.1073/pnas.1212429109. Epub 2012 Sep 24.

Localized cell death focuses mechanical forces during 3D patterning in a biofilm

Affiliations

Localized cell death focuses mechanical forces during 3D patterning in a biofilm

Munehiro Asally et al. Proc Natl Acad Sci U S A. .

Abstract

From microbial biofilm communities to multicellular organisms, 3D macroscopic structures develop through poorly understood interplay between cellular processes and mechanical forces. Investigating wrinkled biofilms of Bacillus subtilis, we discovered a pattern of localized cell death that spatially focuses mechanical forces, and thereby initiates wrinkle formation. Deletion of genes implicated in biofilm development, together with mathematical modeling, revealed that ECM production underlies the localization of cell death. Simultaneously with cell death, we quantitatively measured mechanical stiffness and movement in WT and mutant biofilms. Results suggest that localized cell death provides an outlet for lateral compressive forces, thereby promoting vertical mechanical buckling, which subsequently leads to wrinkle formation. Guided by these findings, we were able to generate artificial wrinkle patterns within biofilms. Formation of 3D structures facilitated by cell death may underlie self-organization in other developmental systems, and could enable engineering of macroscopic structures from cell populations.


Conflict of interest statement

The authors declare no conflict of interest.

Figures

Fig. 1.
Fig. 1.
Localized pattern of cell death correlates with the site of wrinkles in biofilms. (A) Three-day-old B. subtilis biofilm structure. The dashed square indicates the region of interest in this study. (B) Schematic of the microscope setting for fluorescent and bright-field imaging of a biofilm (depicted in gray). Dashed lines indicate the direction of observation. (C) Cross-section florescence image of a 30-h-old biofilm wrinkle, pseudocolored (PftsAZ-CFP in gray and a cell death reporter Sytox in green). (D) Transmission electron (TEM) micrograph of a sectioned biofilm wrinkle shows dead cells (black arrow) in the wrinkle interior (white box in C depicts observed location). (E) Film strip shows biofilm morphology observed from above the colony. (F) Film strip shows CDP during early (∼22 h) development of biofilm, imaged from below. Brightness and contrast are individually adjusted for each time point. (G) Early (dark green) and late (light green) CDPs detected by a correlation-based clustering analysis (SI Materials and Methods) of Sytox time-lapse images.
Fig. 2.
Fig. 2.
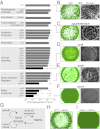
Gene deletion analysis reveals that ECM production is required for the CDP. (A) KO strains are categorized and listed by their functions. The CDP heterogeneity (perimeter squared over the area) of the late CDP (light green) is graphed for each deletion strain (mean ± SD). Asterisks and black shading indicate P values (**P < 0.01; ****P < 0.0001) evaluated using Tukey’s Honestly Significant Difference test. Representative clustered CDP images as in Fig. 1G (Left) and colony morphology (Right) of WT (B), ΔspoIISAB/ndoAI (C), ΔsrfA (D), ΔabrB (E), and ΔepsH (F) strains. The scale for BF is as indicated in B. (G) Schematic of the mathematical model in which local cell density is governed by density-dependent growth and death and the ECM maintains density by preventing expansion (details are provided in SI Text). The CDPs are generated by the mathematical model. Simulations with (H) and without (I) matrix production are processed using the same correlation-based clustering analysis as experimental data.
Fig. 3.
Fig. 3.
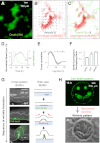
Movement reveals that wrinkle formation in the biofilm is generated by mechanical buckling. (A) Fluorescent beads (black) mixed with cells from the beginning of biofilm formation are shown in an inverted fluorescence image. (B) Movements of beads during biofilm formation are tracked, and their trajectories are shown as black arrows and dots. (Scale bar: 50 μm.) (B and C) Convergence (negative divergence) field (red) of the interpolated vector field calculated from bead trajectories. Convergence images obtained from movements in the time window are indicated in C. (D) Schematic of the hypothesis shows convergence resulting in buckling and wrinkle formation. (E) Three-dimensional surface plot predicted from a convergence field after spatial averaging. (F) Three-dimensional surface plot of the same biofilm as in E observed from above using stereomicroscopy in the same orientation as in E. (G) Areas from E (red) and F (gray) above the respective thresholds represent wrinkle locations merged in two dimensions. (H) Load-displacement curves of WT, ΔsrfA, and ΔabrB obtained by AFM nanoindentation. The faded lines indicate actual measurements results, and the thick lines represent their mean curves. The stiffness (Young’s modulus: tensile stress divided by tensile strain) of each biofilm strain is calculated using these load-displacement curves. The maximum convergence rate determined from each convergence time trace (Fig. S6C) (I) and the wrinkle width (J) are plotted against stiffness (Young’s modulus) for WT, ΔsrfA, and ΔabrB (mean ± SEM).
Fig. 4.
Fig. 4.
Localized cell death facilitated mechanics of wrinkle formation. Magnified view of localized cell death at 18 h (A), velocity field (arrows) and convergence (red) of the same location (B), and merged image of convergence (red, 20–35 h) and cell death outline (green, 18 h) (C). The scale for AC is as indicated in A. (D) Average speed of fluorescent beads in the ΔepsH strain subtracted from that of the WT strain (black line: Speedwt − SpeedΔepsH) (n = 3). The Sytox intensity (green) is shown for WT. The individual time traces for WT and ΔepsH are provided in Fig. S4A. AU, arbitrary unit. (E) Cross-correlation curve (between cell death and convergence) of localized cell death regions analyzed with individual biofilms. The calculated time delay (τ = 6 ± 0.8 h, mean ± SEM, n = 5) is the temporal offset that gives the maximum cross-correlation value between cell death and convergence. (F) Ratio of high-convergence regions that spatially correlate with local early cell death, measured for the WT, ΔsrfA, and ΔabrB strains (mean ± SEM, n = 3). (G) Cross-sectional images and schematic of the wrinkle formation process (green: cell death, light blue: agar medium). (H) Artificial smiley face CDP (Upper) created by painting higher cell density areas and a matching wrinkle pattern (Lower).

Comment in

References

    1. Whitesides GM, Grzybowski B. Self-assembly at all scales. Science. 2002;295:2418–2421. - PubMed
    1. Camazine S, et al. Self-Organization in Biological Systems. Princeton Univ Press, Princeton; 2003.
    1. Woodford C, Zandstra PW. Tissue engineering 2.0: Guiding self-organization during pluripotent stem cell differentiation. Curr Opin Biotechnol. 2012 in press. - PMC - PubMed
    1. Mammoto T, Ingber DE. Mechanical control of tissue and organ development. Development. 2010;137:1407–1420. - PMC - PubMed
    1. Savin T, et al. On the growth and form of the gut. Nature. 2011;476:57–62. - PMC - PubMed

Publication types

MeSH terms