

doi: 10.1186/gb-2012-13-9-r78.
RELATCH: relative optimality in metabolic networks explains robust metabolic and regulatory responses to perturbations
Affiliations
- PMID: 23013597
- PMCID: PMC3506949
- DOI: 10.1186/gb-2012-13-9-r78
Item in Clipboard
RELATCH: relative optimality in metabolic networks explains robust metabolic and regulatory responses to perturbations
Genome Biol.
.
Abstract
Predicting cellular responses to perturbations is an important task in systems biology. We report a new approach, RELATCH, which uses flux and gene expression data from a reference state to predict metabolic responses in a genetically or environmentally perturbed state. Using the concept of relative optimality, which considers relative flux changes from a reference state, we hypothesize a relative metabolic flux pattern is maintained from one state to another, and that cells adapt to perturbations using metabolic and regulatory reprogramming to preserve this relative flux pattern. This constraint-based approach will have broad utility where predictions of metabolic responses are needed.
Figures

Overview of RELATCH framework for predicting metabolic flux distributions in perturbed microbial systems. (a) The metabolic flux distribution (w) and enzyme contributions (Wenz) in a reference state are first estimated using metabolic flux analysis (MFA), physiological measurements, and gene expression data. Variables are shown in bold blue letters and experimental measurements are shown in plain letters. (b) The metabolic flux distribution (v) in a perturbed state is predicted by minimizing the relative flux changes and latent pathway activation from the reference state. Two parameters are used to represent the extent of adaptation to perturbations, a penalty for latent pathway activation (α) and a limit on contribution increase in active enzymes (γ). (c) An illustrative example of using RELATCH to predict the effects of deleting an isozyme, where contributions of two isozymes are shown in green.
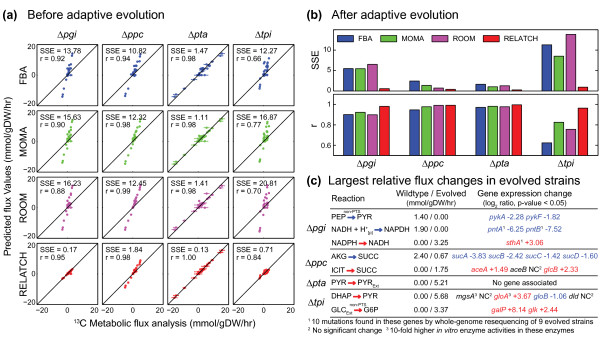
Comparison of MFA estimated flux values and predicted flux values by different methods for four E. coli knockout mutants before and after adaptive evolution. (a) The MFA estimated (x-axis) and predicted (y-axis) flux values, sum of squared errors per flux (SSE) and Pearson's correlation coefficient (r) are shown for each unevolved mutant. Error bars indicate the confidence intervals from MFA. The RELATCH predictions were made using the tight parameter values. (b) SSE and r values for different approaches used to predict behaviors for evolved mutants, where the average MFA results (across two independently evolved strains) were used to calculate the SSE and r values. The RELATCH predictions were made using the relaxed parameter values. (c) Largest relative flux changes predicted by RELATCH in evolved mutant strains. The relative flux changes, determined as ratios of predicted mutant fluxes to wild-type fluxes, were rank-ordered to identify reactions with the largest changes, which were then compared to experimental data, including enzyme activity, gene expression [24], and genetic mutations [27]. AKG, 2-oxoglutarate; DHAP, dihydroxyacetone phosphate; G6P, glucose-6-phosphate; GLCEXT, extracellular glucose; ICIT, isocitrate; PEP, phosphoenolpyruvate; PYR, pyruvate; SUCC, succinate.
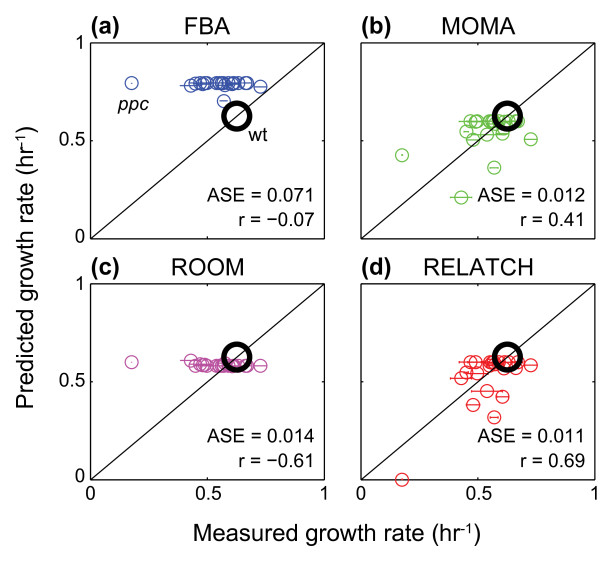
Growth rate predictions for 22 single knockout E. coli mutants using FBA, MOMA, ROOM, and RELATCH with the tight parameter values. (a) FBA, (b) MOMA, (c) ROOM, (d) RELATCH. The large black circles represent the growth rate of the parental strain. The average squared errors across all mutant (ASE; units are hr-2) and the Pearson's correlation coefficient (r) are shown for each method, and the horizontal error bars indicate the standard deviations across the triplicate experiments. Wt, wild type.
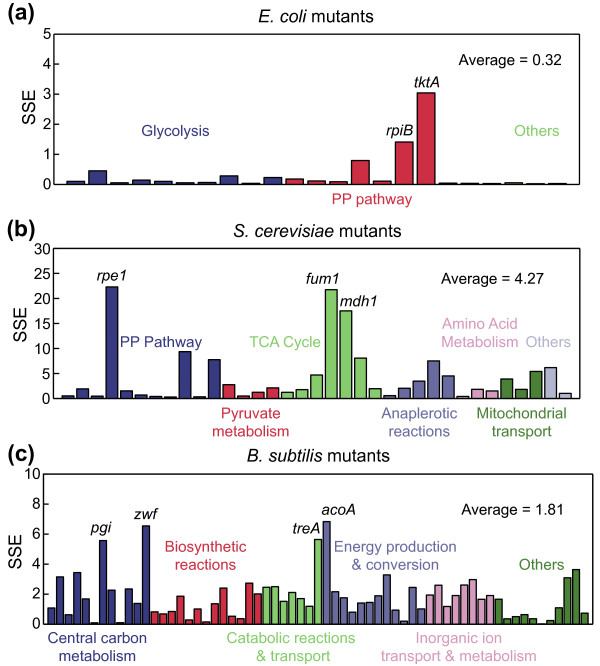
Prediction of metabolic flux distributions in knockout mutants of E. coli, S. cerevisiae, and B. subtilis. (a) E. coli, (b) S. cerevisiae, (c) B. subtilis. The sum of squared errors per flux (SSE) is shown for each mutant strain, and the average SSE across all mutants is shown for each organism. The RELATCH predictions were made using the relaxed parameter values for (a) and the tight parameter values for (b,c) since the strains were grown in a chemostat and batch cultures, respectively. PP, pentose phosphate, TCA, tricarboxylic acid cycle.

Metabolic flux predictions by different methods in environmentally perturbed E. coli wild-type strains. (a-d) The flux distribution of wild type grown aerobically on glucose in a batch (a,b) or chemostat (c,d) culture was used as a reference state to predict fluxes in galactose medium (a), glucose anaerobic condition (b), acetate medium (c), and chemostat (d) at different dilution rates. The RELATCH predictions were made using the tight parameter values for (a) or the relaxed parameter values for (b-d).
References
Publication types
MeSH terms
LinkOut - more resources
Full Text Sources
Other Literature Sources
Molecular Biology Databases
