. 2012 Sep 26;32(39):13363-79.
doi: 10.1523/JNEUROSCI.1900-12.2012.

Distinct functional organizations for processing different motion signals in V1, V2, and V4 of macaque

Affiliations

Distinct functional organizations for processing different motion signals in V1, V2, and V4 of macaque

Xu An et al. J Neurosci. .

Abstract

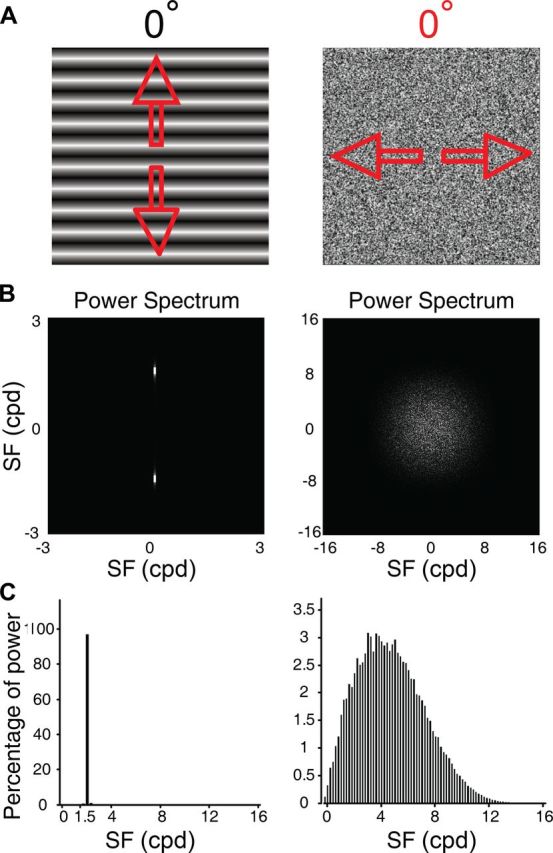
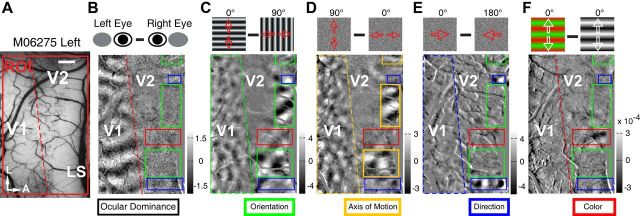
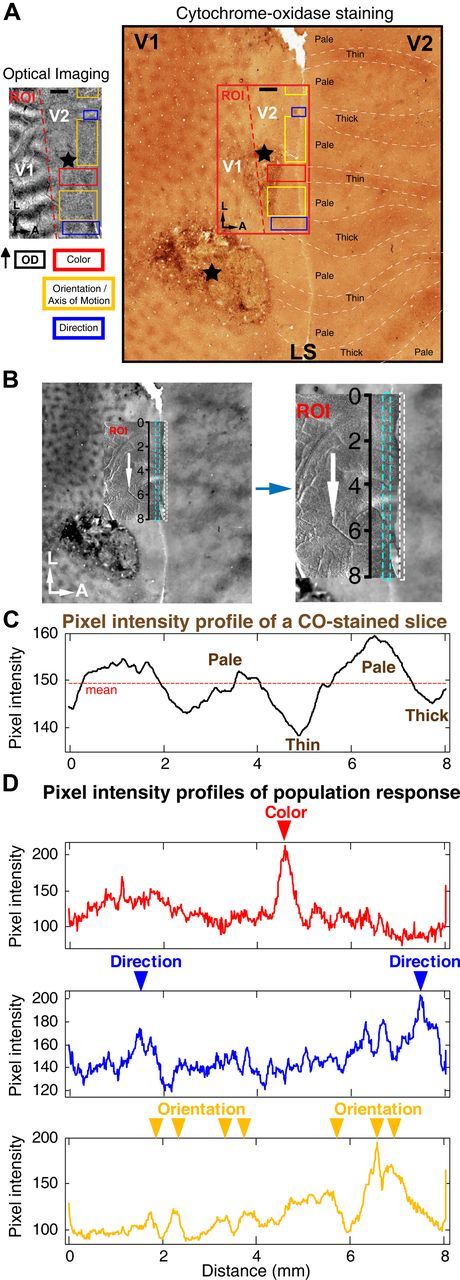
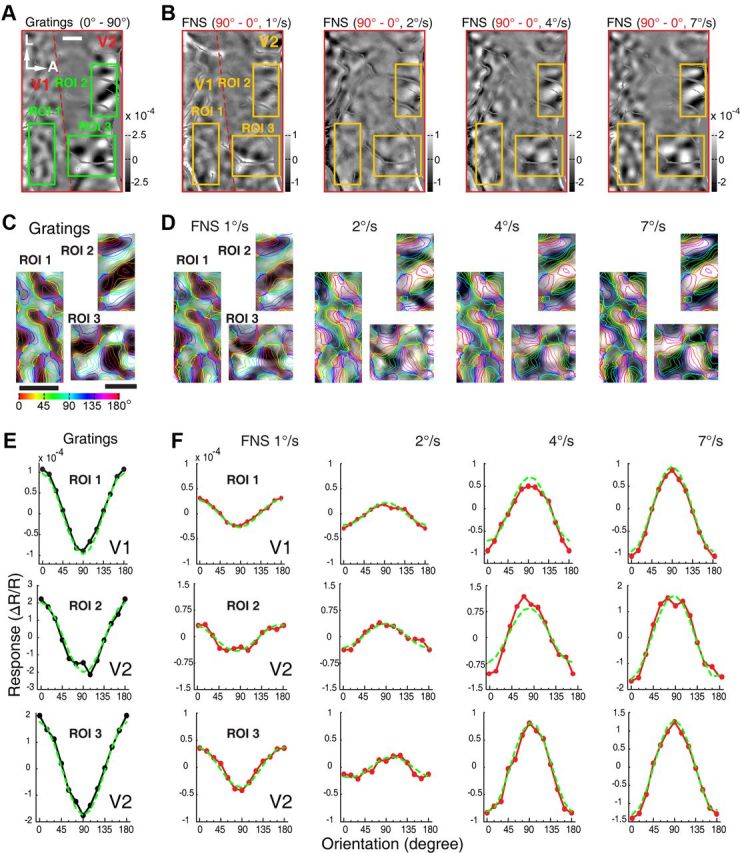
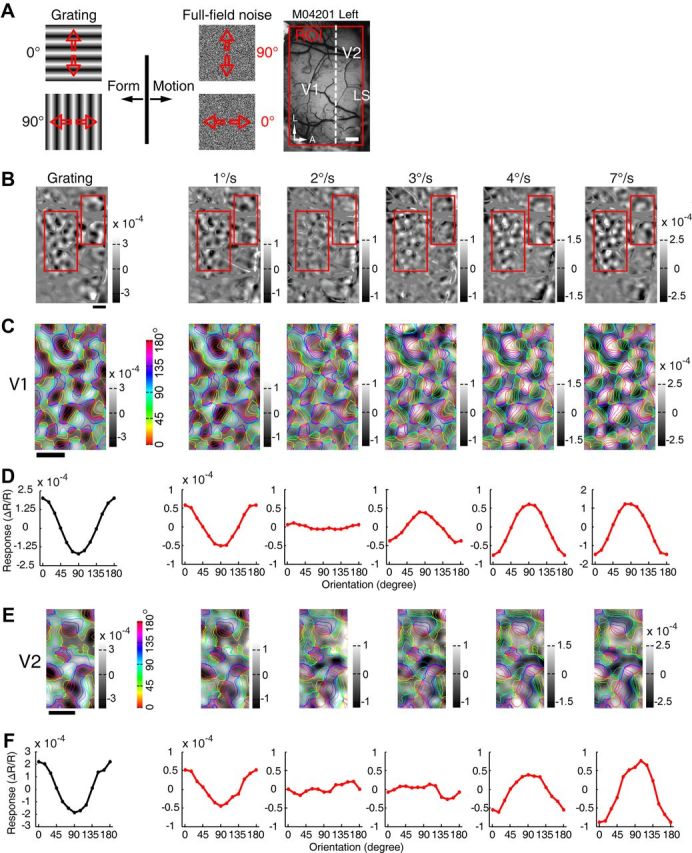
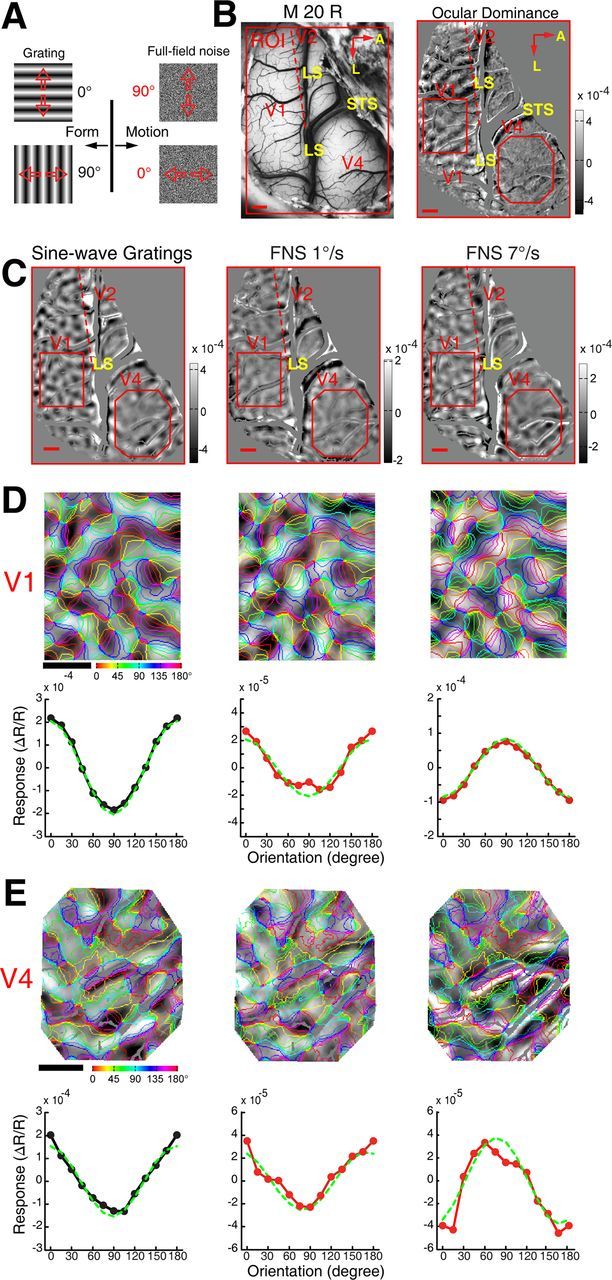
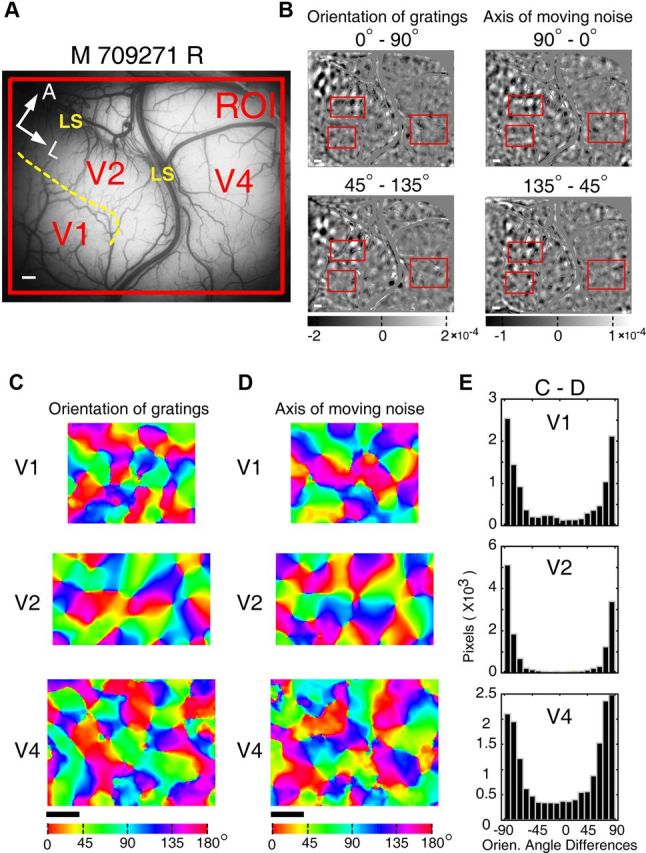
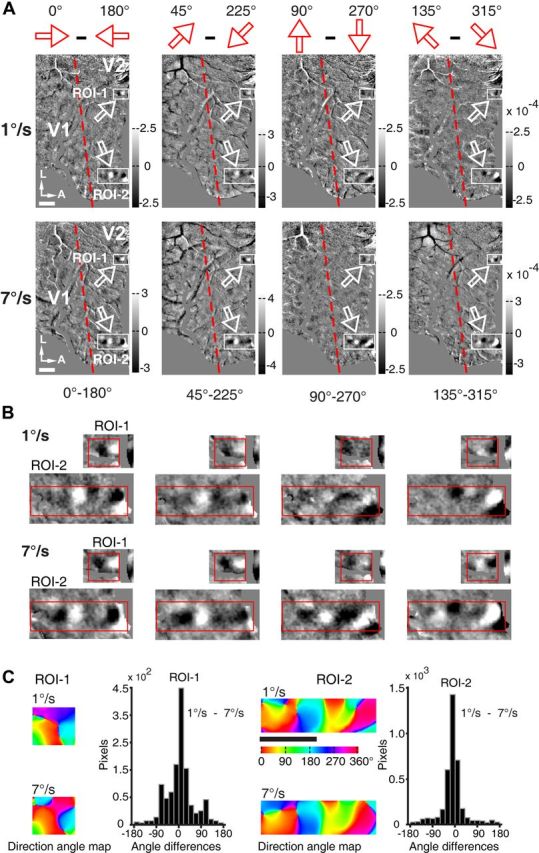
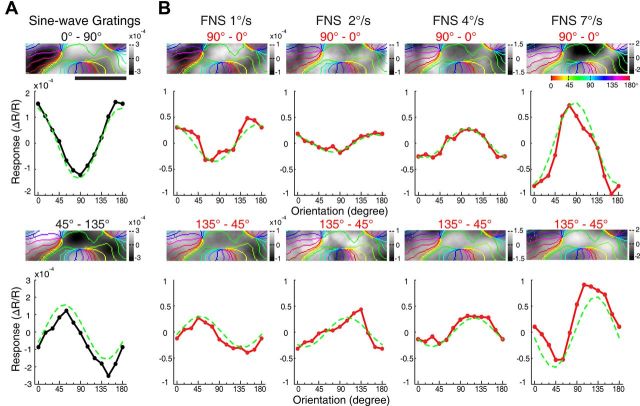
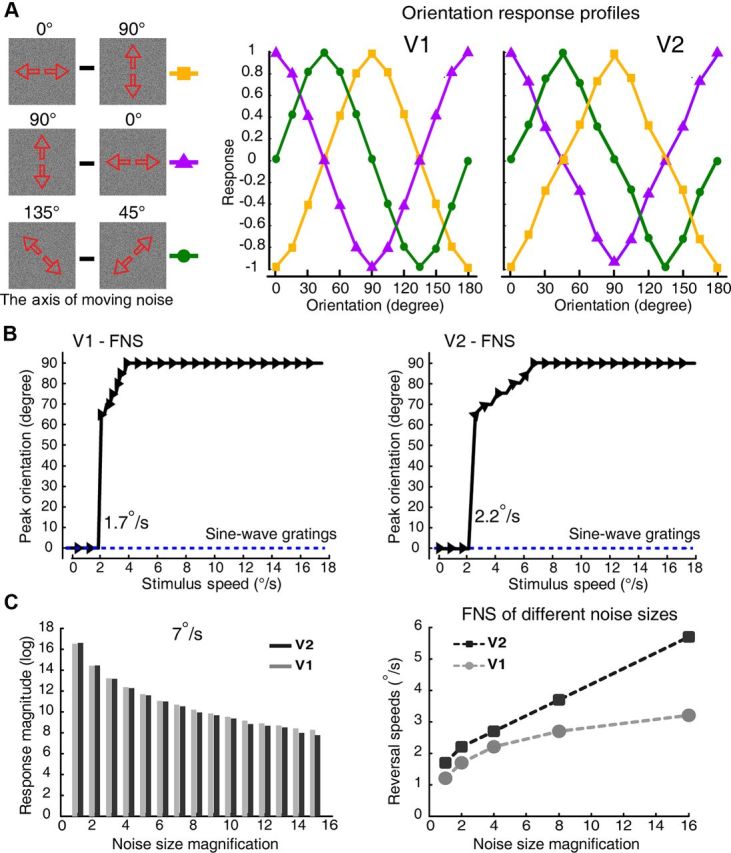
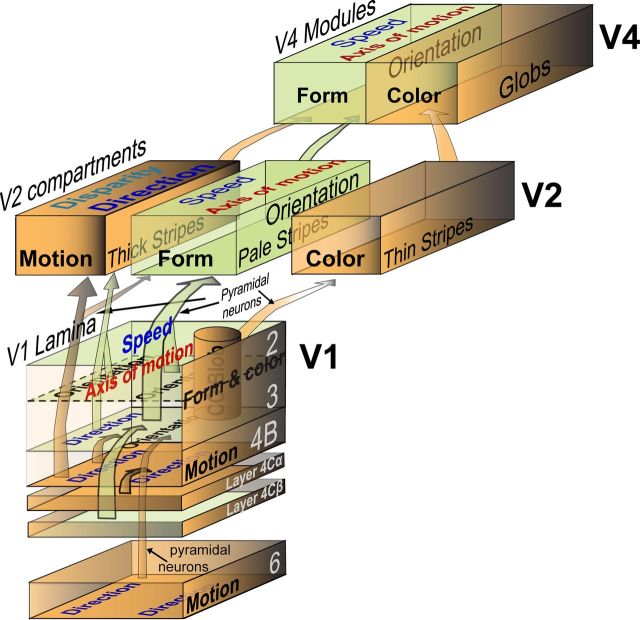
Motion perception is qualitatively invariant across different objects and forms, namely, the same motion information can be conveyed by many different physical carriers, and it requires the processing of motion signals consisting of direction, speed, and axis or trajectory of motion defined by a moving object. Compared with the representation of orientation, the cortical processing of these different motion signals within the early ventral visual pathway of the primate remains poorly understood. Using drifting full-field noise stimuli and intrinsic optical imaging, along with cytochrome-oxidase staining, we found that the orientation domains in macaque V1, V2, and V4 that processed orientation signals also served to process motion signals associated with the axis and speed of motion. In contrast, direction domains within the thick stripes of V2 demonstrated preferences that were independent of motion speed. The population responses encoding the orientation and motion axis could be precisely reproduced by a spatiotemporal energy model. Thus, our observation of orientation domains with dual functions in V1, V2, and V4 directly support the notion that the linear representation of the temporal series of retinotopic activations may serve as another motion processing strategy in primate ventral visual pathway, contributing directly to fine form and motion analysis. Our findings further reveal that different types of motion information are differentially processed in parallel and segregated compartments within primate early visual cortices, before these motion features are fully combined in high-tier visual areas.


Figures

Figure 1.
Figure 1.
The visual stimuli and their Fourier spectra. A, Stimulus diagrams of the sine-wave grating (0° orientation) at SF 1.5 cpd and the standard FNS moving along 0° motion axis. Arrows indicate the directions of motion. B, The Fourier power spectra. For the sine-wave grating, two bright spots demonstrate that most stimulus power is presented at a single spatial frequency and orientation. Note that the Fourier power spectrum of the static FNS shows uniform distribution in orientation dimension. C, Percentage of Fourier power along the SF dimension. The majority of power (85%) for FNS resides below SF 7.41 cpd.
Figure 2.
Figure 2.
Distinct functional domains within V1 and V2 in the left hemisphere of macaque M06275. A, Cortical surface of V1 and V2 taken under 550 nm green-light illumination. The recorded ROI is indicated by the red box. A, Anterior; L, lateral. Scale bar, 1 mm. B, Differential OD map. Note that OD stripes run approximately perpendicular to V1/V2 border and are absent in V2. C, Differential orientation map obtained using stimuli of sine-wave gratings (0° vs 90°). Dark and bright areas correspond to orientation domains preferring 0 and 90°, respectively. Diagrams of the actual stimuli are displayed above the map. D, Differential motion-axis map. FNS drifted along motion axes of 90 and 0° in the experiment. Note that the pattern of motion-axis domains mirrors that activated by the gratings in C in an inverted fashion. E, Differential direction map. The diagrams of stimuli depict a pair of FNS moving in opposite directions (0° vs 180°). Note that direction-responsive domains were only found in V2 and spatially segregated from orientation domains. F, Color domain in V2 obtained using a drifting red-green of iso-luminance versus a drifting black–white sine-wave grating. The colored boxes indicate different functional domains corresponding to different visual features as described underneath each map.
Figure 3.
Figure 3.
Spatial alignment of cortical functional domains and CO stained stripes of a flattened V2 in the left hemisphere of macaque M06275. A, Differential OD map as shown in Figure 2B. CO staining revealed clear blobs in V1 and the pale, thin, and thick stripes in V2. Colored boxes within ROI represent the different functional domains activated by different visual stimuli (Fig. 2C–F), and were aligned with the histological section containing the same region of V1 and V2. Optical-imaging recordings were performed on the ROI before the histological study. Note that areas of V2 situated to the right of LS were unfolded for CO straining to show the full cycles of pale, thin, pale, and thick stripes. Black stars, Two lesions made after optical-imaging experiment. A, Anterior; L, lateral. Scale bar, 1 mm. B, The rectangular area selected for pixel intensity analysis along LS. C, Pixel intensity profile of a slice of CO-stained V2 stripes. Averaged pixel intensity was plotted as the dashed red line. D, Pixel intensity profiles of a rectangular area of each differential map coding different visual features.
Figure 4.
Figure 4.
Motion-axis maps activated by FNS moving at different speeds in V1 and V2 in the left hemisphere of macaque M06275. A, Differential orientation map for sine-wave gratings (0–90°). Three different ROIs (one in V1, two in V2) outlined by the green boxes were analyzed in detail. Blood vessels were colored gray. B, Differential motion-axis maps generated by FNS drifted at different speeds. The ROIs boxed in yellow are identical to those in A. C, D, Magnified maps from representative ROIs of V1 and V2 for grating stimuli and FNS, respectively. Regions covered by blood vessels were interpolated to reveal the complete response patterns. E, F, Results of orientation response profile analysis from corresponding ROIs of C and D. Note that when the FNS moving speed exceeded 1°/s, the population response profiles inverted in comparison with those activated by sine-wave gratings and FNS with moving speed of 1°/s. Scale bar, 1 mm.
Figure 5.
Figure 5.
Further example of motion-axis domains in V1 and V2 in the left hemisphere of macaque M04201. A, Stimulus diagrams of sine-wave gratings and FNS. Red arrows indicate motion directions. Recording area was outlined by a red box overlaid onto an image of the cortical surface of V1 and V2 taken under green-light illumination (550 nm). A, Anterior; L, lateral. LS runs just to the right of the imaged area. B, Differential orientation maps generated by pairs of sine-wave gratings with orthogonal orientations (0–90°) and FNS moving along orthogonal motion axes (90–0°) with different speeds (1, 2, 3, 4, and 7°/s). Blood vessels were colored gray. Note that the white and black polarities of orientation domains activated by FNS inverted when the moving speed exceeded 2°/s. Red boxes indicate ROIs of V1 and V2 selected for further analysis. C, E, Magnified maps from representative ROIs in B. D, F, Results of orientation response profile analysis for response maps in C and E, respectively. Note that when the FNS moving speed exceeded 2°/s, the response profiles inverted compared with those activated by the sine-wave gratings and the FNS with moving speed of 1°/s. Scale bar, 1 mm.
Figure 6.
Figure 6.
Motion-axis domains within V1, V2, and V4 recorded simultaneously in the right hemisphere of macaque 20. A, Diagrams of the visual stimuli. B, The cortical vasculature in the imaged region of V1, V2, and V4. The red dashed line depicts the border between V1 and V2 as revealed by OD map (right). Note in this animal most of V2 was embedded underneath the LS. The red subregions overlaid on the OD map (right) and on the differential maps in C indicate areas of V1 and V4 that were further analyzed in D and E. Scale bar, 1 mm. C, Differential orientation map obtained with drifting sine-wave gratings and motion-axis maps generated by FNS moving at speeds of 1 and 7°/s. The bright and dark polarities of the orientation domains in the small exposed area of V2 activated by the axis of moving noise at 7°/s were inverted with respect to those activated by sine-wave gratings. Blood vessels and other noisy regions were masked gray. D, E, Magnified maps from representative areas of V1 and V4 with the results from orientation response profile analysis shown underneath. No orientation response profiles were generated for V2 because there was very little of V2 exposed. Similar findings were also obtained using FNS moving at speeds of 1 and 7°/s along 135 and 45° axes.
Figure 7.
Figure 7.
Further example of motion-axis domains within V1, V2, and V4 recorded simultaneously in macaque 709271 right hemisphere. A, The recorded region of V1, V2, and V4. The yellow dashed line depicts the border between V1 and V2. A, Anterior; L, lateral. Scale bar, 1 mm. B, Differential orientation maps generated using drifting sine-wave gratings (0–90° and 45–135°), and motion-axis maps produced by drifting FNS (90–0° and 135–45°). The red boxed ROIs in V1, V2, and V4 were further analyzed in C–E. Blood vessels and other noisy regions were masked gray. C, D, Orientation preference maps (color map) generated using vector summation method from representative regions of V1, V2, and V4 (outlined by the red boxes in B). Colors depict the full range of orientation preferences. E, Histograms produced by subtracting different pairs of color maps of the same visual area in C and D. The histograms display the distribution of angular differences in preferred orientations between the two sets of maps. All the resulting histograms peak around ±90°, demonstrating orthogonal orientation preference for sine-wave gratings and FNS with a moving speed of 7°/s in V1, V2, and V4.
Figure 8.
Figure 8.
The direction-selective responses recorded in V2 from the left hemisphere of macaque M06275. A, Differential direction maps in V2. Moving FNS of 1 and 7°/s were used to produce these differential maps. In each image the red dashed line delineates the V1 and V2 border. Scale bar, 1 mm. White arrows point to the only regions with direction-selective responses in V2 (examined in details in B and C). Blood vessels and unrelated marginal regions were colored with gray. B, The ROIs outlined in A were magnified for a clearer view and easier comparison. C, Detailed analysis of the direction preference maps in the two ROIs outlined in B. Direction angle maps depict the direction preferences of the two ROIs for FNS moving at 1 and 7°/s. Histograms show the angular differences between the direction angle maps generated by FNS at moving speeds of 1 and 7°/s. The percentages of pixels possessed angular differences between −60° to 60° amounted to 73 and 85% in ROI 1 and ROI 2, respectively, indicating highly matched direction preference maps produced by FNS with moving speeds of 1 and 7°/s.
Figure 9.
Figure 9.
Motion-axis domains within a thick stripe in V2, from the left hemisphere of macaque M06275. A, Differential orientation maps produced by sine-wave gratings (0–90° and 45–135°) from ROI 2 in Figure 8, a region that showed robust direction-selective responses. The corresponding orientation response profiles are shown underneath each differential map. B, Differential motion-axis maps generated by FNS drifted at different speeds. The results of response profile analysis at each speed are shown underneath each motion-axis map. Note that when the FNS moving speed exceeded 2°/s, the population response profiles inverted in comparison with those generated by gratings and FNS with moving speed of 1°/s. Scale bar, 1 mm.
Figure 10.
Figure 10.
Spatiotemporal energy model simulation for the population responses coding motion axis in V1 and V2. A, Model simulation results for different pairs of motion axes of FNS with the moving speed of 1°/s. The diagrams of stimuli are shown to the left and the simulated results of different motion axes for macaque V1 and V2 at the speed of 1°/s are shown in the middle and right. B, The drastic change of peak orientation preferences to different speeds in both V1 and V2, predicted by the energy model simulation for motion-axis condition of 90–0°. The peak orientations for sine-wave gratings (0–90°) drifting bidirectionally were also simulated and indicated as blue dashed lines. The model predicted the critical speeds for the transition of preference of the motion axis in V1 and V2 to be 1.7 and 2.2 °/s. C, The energy model simulation for the effects of varying noise sizes on the reversal speed. As noise size increases, there are large decreases in the magnitude of simulated population responses at all speeds tested (results of 7°/s were shown, left). When the noise size increases to 16 times that of the pixel size of our initial noise texture, the transition speeds for the orientation preference of model neurons increased from 1.2 to 3.2°/s for V1 and from 1.7 to 5.7°/s for V2 (right).
Figure 11.
Figure 11.
Summary of the main findings. A schematic of the segregated and parallel pathways for distinct processing of different motion signals in V1, V2, and V4 of macaque ventral visual pathway, encapsulating our findings with those of previous studies. Here we illustrate only the main feedforward projections. Essentially, the orientation domains mapped in V1, V2, and V4 not only process contour orientation signals but also process motion signals associated with motion axis and speed. In contrast, the direction-selective responses recorded in V2 thick stripes are independent of motion speed.

References

    1. Adelson EH, Bergen JR. Spatiotemporal energy models for the perception of motion. J Opt Soc Am A. 1985;2:284–299. - PubMed
    1. Adelson EH, Movshon JA. Phenomenal coherence of moving visual patterns. Nature. 1982;300:523–525. - PubMed
    1. Albright TD. Direction and orientation selectivity of neurons in visual area MT of the macaque. J Neurophysiol. 1984;52:1106–1130. - PubMed
    1. Albright TD. Form-cue invariant motion processing in primate visual cortex. Science. 1992;255:1141–1143. - PubMed
    1. Albright TD, Desimone R, Gross CG. Columnar organization of directionally selective cells in visual area MT of the macaque. J Neurophysiol. 1984;51:16–31. - PubMed

Publication types

Substances

LinkOut - more resources