. 2012 Dec 1;125(Pt 23):5745-57.
doi: 10.1242/jcs.109769. Epub 2012 Sep 26.

Mitochondrial hyperfusion induced by loss of the fission protein Drp1 causes ATM-dependent G2/M arrest and aneuploidy through DNA replication stress

Affiliations

Mitochondrial hyperfusion induced by loss of the fission protein Drp1 causes ATM-dependent G2/M arrest and aneuploidy through DNA replication stress

Wei Qian et al. J Cell Sci. .

Abstract

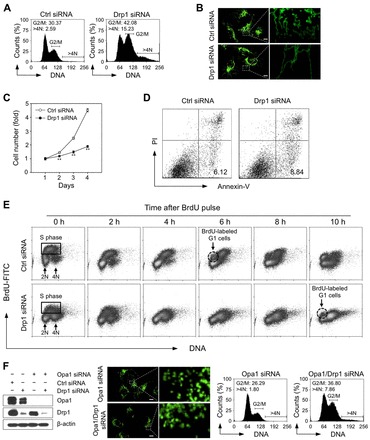
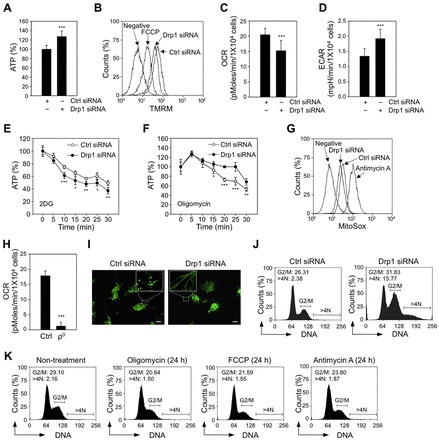
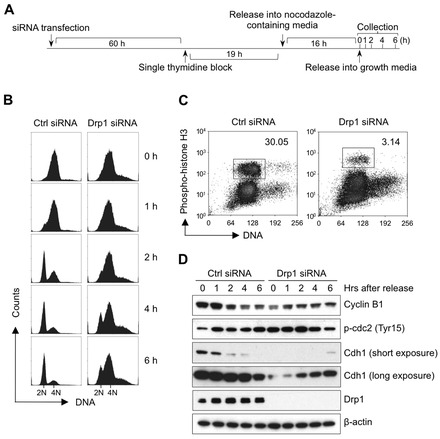
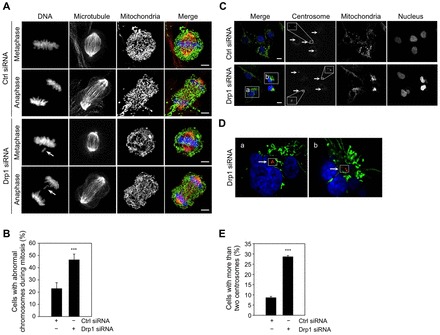
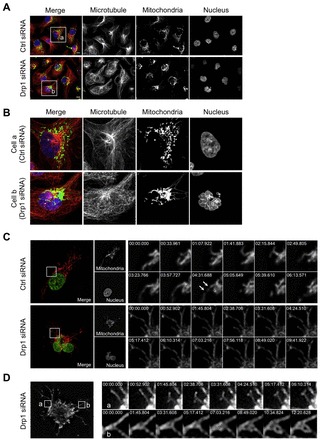
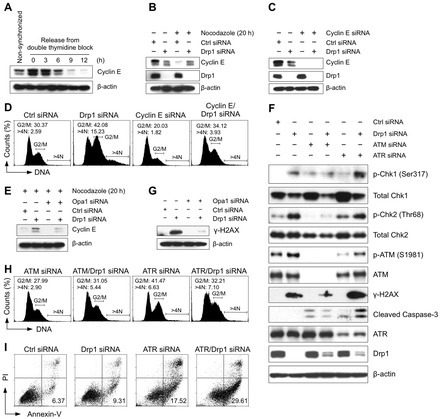
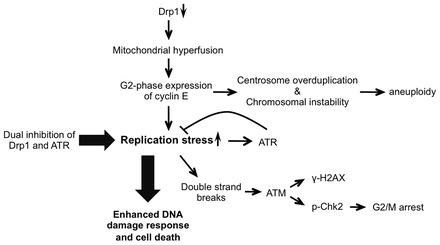
Mitochondrial fission and fusion cycles are integrated with cell cycle progression. In this paper, we demonstrate that the inhibition of mitochondrial fission protein Drp1 causes an unexpected delay in G2/M cell cycle progression and aneuploidy. In investigating the underlying molecular mechanism, we revealed that inhibiting Drp1 triggers replication stress, which is mediated by a hyperfused mitochondrial structure and unscheduled expression of cyclin E in the G2 phase. This persistent replication stress then induces an ATM-dependent activation of the G2 to M transition cell cycle checkpoint. Knockdown of ATR, an essential kinase in preventing replication stress, significantly enhanced DNA damage and cell death of Drp1-deficienct cells. Persistent mitochondrial hyperfusion also induces centrosomal overamplification and chromosomal instability, which are causes of aneuploidy. Analysis using cells depleted of mitochondrial DNA revealed that these events are not mediated by the defects in mitochondrial ATP production and reactive oxygen species (ROS) generation. Thus dysfunctional mitochondrial fission directly induces genome instability by replication stress, which then initiates the DNA damage response. Our findings provide a novel mechanism that contributes to the cellular dysfunction and diseases associated with altered mitochondrial dynamics.


Figures

Fig. 1.
Fig. 1.
Loss of the fission protein Drp1 causes mitochondrial hyperfusion and induces G2/M cell cycle arrest and aneuploidy. (A) Loss of Drp1 induces G2/M cell cycle arrest and aneuploidy. MDA-MB-231 cells were examined four days after their transfection with control siRNA or Drp1 siRNA. Cell cycle distribution was determined by flow cytometric analysis of propidium iodide-stained cells. The graph indicates the percentage of cells containing the DNA content of 4N (G2 and M phase cells) and the DNA content greater than 4N (aneuploidy cells). These data represent three independent experiments. (B) Loss of Drp1 causes mitochondrial hyperfusion. Changes in mitochondrial morphology are visible in the control cells and in Drp1-deficient MDA-MB-231 cells that express pAcGFP1-Mito. The bars indicate 10 µm. (C) Loss of Drp1 causes decreased cell proliferation. Proliferation of the control cells and Drp1-deficient MDA-MB-231 cells was determined by using a CyQUANT assay. These data represent the mean ± s.d.; n = 4 wells. **P<0.01. (D) Loss of Drp1 does not enhance apoptotic cell death. Apoptosis was determined by annexin V assay four days after the cells were transfected with control siRNA or with Drp1 siRNA. The scatter plot graph indicates the percentage of annexin V-positive and PI-negative early apoptotic cells. (E) BrdU pulse-chase time course assay after the cells were transfected with the control siRNA or Drp1 siRNA for three days. Cells were incubated with 10 µM BrdU for 30 min (pulse) and the cell cycle progression of BrdU-labeled cells (S phase cells) was followed for the indicated time points (i.e. the chase). (F) Loss of the fusion protein Opa1 reverses the phenotypes observed in Drp1-deficient cells. Immunoblots show the knockdown efficiency of Opa1 and Drp1 in MDA-MB-231 cells. Changes in mitochondrial morphology are visible in Opa1 knockdown cells and Opa1/Drp1 double knockdown MDA-MB-231 cells that express pAcGFP1-Mito. The bars indicate 10 µm. Cell cycle distribution was determined as previously described.
Fig. 2.
Fig. 2.
The G2/M cell cycle arrest and aneuploidy observed in Drp1-deficient cells are not caused by changes in mitochondrial energy metabolism. (A) Loss of Drp1 does not deplete the total intracellular ATP levels. The ATP levels were measured after transfection with siRNA for four days (in Fig. 2 all measurements were performed four days after transfection). Data are presented as the mean ± the standard deviation (s.d.); n = 3 wells. ***P<0.005. (B) Loss of Drp1 induces a slight decrease in the mitochondrial membrane potential, which was measured after incubating cells with 20 nM of TMRM for 20 min. Cells that were not incubated with TMRM were used as a negative control. Cells treated with 10 µM of FCCP for 20 min were used as a positive control to show depolarized mitochondrial membrane potential. (C,D) Loss of Drp1 impacts the oxygen consumption rate (OCR) (C) and the extracellular acidification rate (ECAR) (D). The OCR and ECAR were measured by using a Seahorse Extracellular Flux analyzer. These data represent the mean ± s.d.; n = 3 wells. ***P < 0.005. (E,F) Loss of Drp1 suppresses mitochondrial ATP generation. The contribution of mitochondria (E) and contribution of glycolysis (F) to total intracellular ATP levels were determined by measuring the changes in total intracellular ATP levels over time in the presence of 100 mM 2DG and 1 µg/ml of oligomycin, respectively. ATP levels were monitored at 5-minute intervals for 30 min. These data represent the mean ± s.d.; n = 3 wells. *P<0.05; **P<0.01; ***P<0.005 (G) Loss of Drp1 does not increase mitochondrial superoxide levels, which were measured after incubating cells with 2.5 µM of MitoSox for 20 min. Cells that were not incubated with MitoSox were used as a negative control. Cells treated with 20 µg/ml of antimycin A for 20 min were used as a positive control to show increased mitochondrial superoxide generation. (H) Oxygen consumption is dramatically decreased in MDA-MB-231 ρ0 cells. OCR was measured by using a Seahorse Extracellular Flux analyzer. These data represent the mean ± s.d.; n = 3 wells. ***P < 0.005. (I) Loss of Drp1 induces mitochondrial hyperfusion in MDA-MB-231 ρ0 cells. Changes in mitochondrial morphology were visualized by staining the control cells and the Drp1-deficient MDA-MB-231 ρ0 cells with 100 nM of MitoTracker green FM for 20 min. The bars represent 10 µm. (J) Loss of Drp1 induces G2/M cell cycle arrest and aneuploidy in MDA-MB-231 ρ0 cells. Cell cycle distribution was determined by flow cytometric analysis of propidium iodide stained cells. The percentage of cells containing DNA content of 4N and DNA content greater than 4N is indicated. (K) Pharmacological inhibition of mitochondrial respiration, depolarization of mitochondrial membrane potential, or stimulation of mitochondrial ROS production does not induce G2/M cell cycle arrest or aneuploidy. MDA-MB-231 cells were treated with 5 µg/ml oligomycin, 5 µM FCCP, or 10 µg/ml antimycin A for 24 h. Cell cycle distribution was determined as described above.
Fig. 3.
Fig. 3.
The G2/M cell cycle arrest observed in Drp1-deficient cells is not caused by disruptions in the molecular machinery that is essential for the G2/M cell cycle transition. (A) The schematic indicates the thymidine/nocodazole block protocol used to synchronize siRNA-transfected cells in the G2/M phase. (B) Loss of Drp1 prevents cell cycle progression after the release from the G2/M block. Control cells and Drp1-deficient cells were released from a thymidine/nocodazole block and cell cycle distribution was determined by flow cytometric analysis of propidium iodide stained cells collected at the indicated time points (right). (C) Loss of Drp1 decreases the number of cells in mitosis immediately after the thymidine/nocodazole block. Control cells and Drp1-deficient cells were synchronized and cells expressing phospho-histone H3 were labeled by using Alex Fluor 647-conjugated anti-phospho-histone H3 antibody and detected by flow cytometry. (D) Loss of Drp1 suppresses the factors that are essential for mitotic entry. Control cells and Drp1-deficient cells were synchronized and collected at the indicated time points after release. The changes in the proteins that are associated with mitotic entry were analyzed by western blot. These data represent three independent experiments.
Fig. 4.
Fig. 4.
Loss of Drp1 induces chromosomal instability and centrosome overamplification. (A,B) Loss of Drp1 induces chromosome abnormalities in mitosis. (A) Mitotic chromosomes were visualized in the control cells and Drp1-deficient cells stably expressing pAcGFP1-Mito by DAPI staining. Microtubules were visualized by staining cells with Alex Fluor 555-conjugated anti-β-tubulin antibody. The images show representative cells in metaphase and anaphase. Arrows indicate lagging chromosomes. The bars indicate 5 µm. (B) The percentage of mitotic control cells and Drp1-deficient cells with abnormal chromosomes was determined by counting at least 30 mitotic cells from three independent slides. These data represent the mean ± the standard deviation (s.d.). *** P<0.005. (C-E) Loss of Drp1 induces centrosome overamplification. (C) Centrosomes in control and Drp1-deficient cells stably expressing pAcGFP1-Mito were visualized by staining cells with anti-γ-tubulin antibody, followed by secondary Alex Fluor 594 goat anti-mouse antibody. The nuclei were visualized by DAPI staining. Arrows indicate the centrosomes. The bars indicate 10 µm. (D) Enlarged images of box a and box b in panel C of a single focal plane from Drp1 knockdown cells. (E) The percentage of control and Drp1-deficient cells with more than two centrosomes was determined by counting at least 100 cells from three independent slides. These data represent the mean ± the standard deviation (s.d.). ***P<0.005.
Fig. 5.
Fig. 5.
Loss of Drp1 induces mitochondrial aggregation around the microtubule organizing center (MTOC). (A,B) In Drp1-deficient cells mitochondria aggregate around the MTOC. (A) Microtubules in control cells and in Drp1-deficient cells stably expressing pAcGFP1-Mito were visualized by staining the cells with Alex Fluor 555-conjugated anti-β-tubulin antibody. Their nuclei were visualized by DAPI staining. Regions with concentrated microtubule staining indicate the locations of MTOC. The bars indicate 10 µm. (B) Enlarged images of box a and box b in panel A represent the control cells and Drp1-deficient cells, respectively. (C) Loss of Drp1 results in reduced mitochondrial motility and redistribution. Mitochondrial dynamics were recorded over time in the control cells and Drp1-deficient MDA-MB-231 cells stably expressing pDsRed2-Mito and histone H2B-GFP. Image sequences show representative mitochondrial movements in the indicated region. Arrows indicate fission events. (D) Mitochondrial remodeling in Drp1-deficient cells. Image sequences obtained in region a show a mitochondrial branching event and in region b show transformation of the mitochondrial structure from a single fork shape to a netlike morphology.
Fig. 6.
Fig. 6.
The G2/M cell cycle arrest and aneuploidy observed in Drp1-deficient cells result from replication stress-initiated DNA damage signaling that involves ATM/Chk2 and ATR/Chk1 kinases. (A) Cyclin E expression during the cell cycle. MDA-MB-231 cells were synchronized at G1/S border by a double thymidine block and then released in fresh media containing nocodazole. Cells were then harvested at the indicated time points, and the expression of cyclin E was detected by western blot. (B) Loss of Drp1 causes an accumulation of cyclin E in the G2/M phase. Cyclin E expression was assessed by western blot by using cell extracts generated from the control cells and from Drp1-deficient cells in the presence or absence of nocodazole for 20 h. (C) Knockdown efficiency of cyclin E and Drp1 was confirmed by western blot. (D) The loss of cyclin E reverses the G2/M cell cycle arrest and aneuploidy observed in Drp1-deficient cells. Four days after siRNA transfection, cell cycle distribution was determined by flow cytometric analysis of propidium iodide stained cells. The percentage of cells containing a DNA content of 4N and DNA content greater than 4N is indicated. (E) Loss of Opa1 reverses cyclin E accumulation in G2/M phase observed in Drp1-deficient cells. (F) Loss of Drp1 induces a DNA damage response. Cells were transfected with the indicated siRNA for four days and the changes in the proteins associated with the DNA damage response were assessed by western blot. (G) Loss of Opa1 prevented the accumulation of γ-H2AX in Drp1-deficient cells. (H) Loss of ATM reverses the G2/M cell cycle arrest and aneuploidy observed in Drp1-deficient cells, whereas the loss of ATR induces G2/M cell cycle arrest and aneuploidy. Four days after siRNA transfection, the cell cycle distribution was determined, as previously described. (I) ATR is essential for the survival of Drp1-deficient cells. Cells were transfected with the indicated siRNA for four days and apoptosis was assessed by annexin V and PI staining. The percentage of annexin V-positive and PI-negative early apoptotic cells is indicated. These data represent three independent experiments.
Fig. 7.
Fig. 7.
Loss of Drp1 induces replication stress-mediated genome instability. Our working model shows that mitochondrial hyperfusion that is induced by loss of the fission protein Drp1 leads to replication stress, centrosome overduplication, and chromosomal instability. These are mediated, at least in part, by the aberrant expression of cyclin E in the G2-phase. Persistent replication stress activates an ATM kinase signaling cascade that induces a G2/M cell cycle checkpoint. This is consistent with our data, which show that knockdown of the fusion protein Opa1, cyclin E or ATM reverses the G2/M cell cycle arrest and aneuploidy observed in Drp1-deficient cells. ATR kinase is essential for DNA damage responses to replication stress. Loss of Drp1 induces replication stress, which is further increased by the loss of ATR. This subsequently increases DNA damage and cell death.

References

    1. Bartkova J., Horejsí Z., Koed K., Krämer A., Tort F., Zieger K., Guldberg P., Sehested M., Nesland J. M., Lukas C.et al. (2005). DNA damage response as a candidate anti-cancer barrier in early human tumorigenesis. Nature 434, 864–870 10.1038/nature03482 - DOI - PubMed
    1. Cassidy–Stone A., Chipuk J. E., Ingerman E., Song C., Yoo C., Kuwana T., Kurth M. J., Shaw J. T., Hinshaw J. E., Green D. R.et al. (2008). Chemical inhibition of the mitochondrial division dynamin reveals its role in Bax/Bak-dependent mitochondrial outer membrane permeabilization. Dev. Cell 14, 193–204 10.1016/j.devcel.2007.11.019 - DOI - PMC - PubMed
    1. Cho D. H., Nakamura T., Fang J., Cieplak P., Godzik A., Gu Z., Lipton S. A. (2009). S-nitrosylation of Drp1 mediates β-amyloid-related mitochondrial fission and neuronal injury. Science 324, 102–105 10.1126/science.1171091 - DOI - PMC - PubMed
    1. Cimprich K. A., Cortez D. (2008). ATR: an essential regulator of genome integrity. Nat. Rev. Mol. Cell Biol. 9, 616–627 10.1038/nrm2450 - DOI - PMC - PubMed
    1. Cipolat S., Martins de Brito O., Dal Zilio B., Scorrano L. (2004). OPA1 requires mitofusin 1 to promote mitochondrial fusion. Proc. Natl. Acad. Sci. USA 101, 15927–15932 10.1073/pnas.0407043101 - DOI - PMC - PubMed

Publication types

MeSH terms