. 2012 Sep 27:12:150.
doi: 10.1186/1471-2288-12-150.

Adjustment for reporting bias in network meta-analysis of antidepressant trials

Affiliations

Adjustment for reporting bias in network meta-analysis of antidepressant trials

Ludovic Trinquart et al. BMC Med Res Methodol. .

Abstract

Background: Network meta-analysis (NMA), a generalization of conventional MA, allows for assessing the relative effectiveness of multiple interventions. Reporting bias is a major threat to the validity of MA and NMA. Numerous methods are available to assess the robustness of MA results to reporting bias. We aimed to extend such methods to NMA.

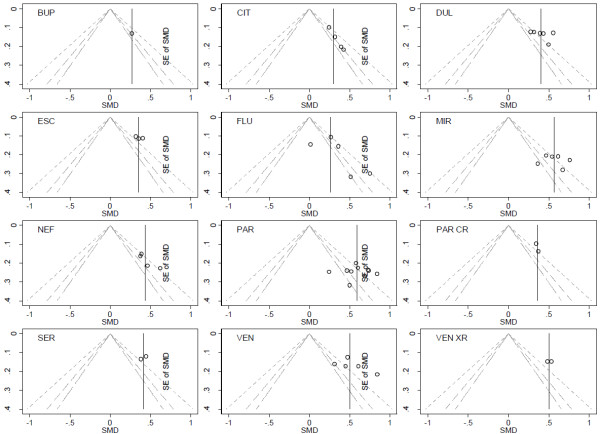
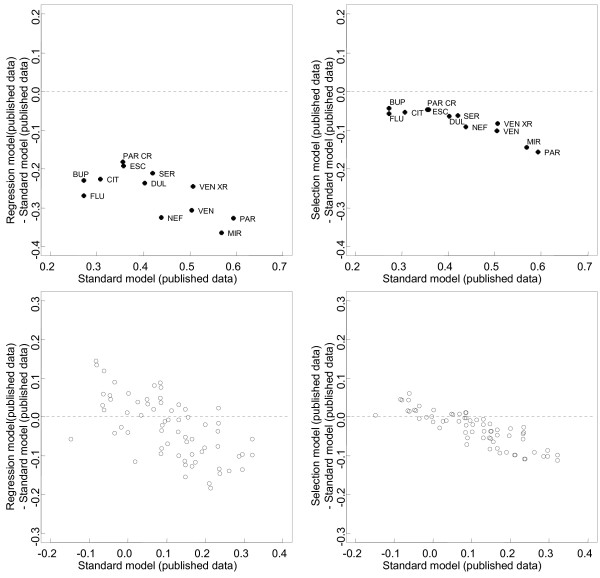
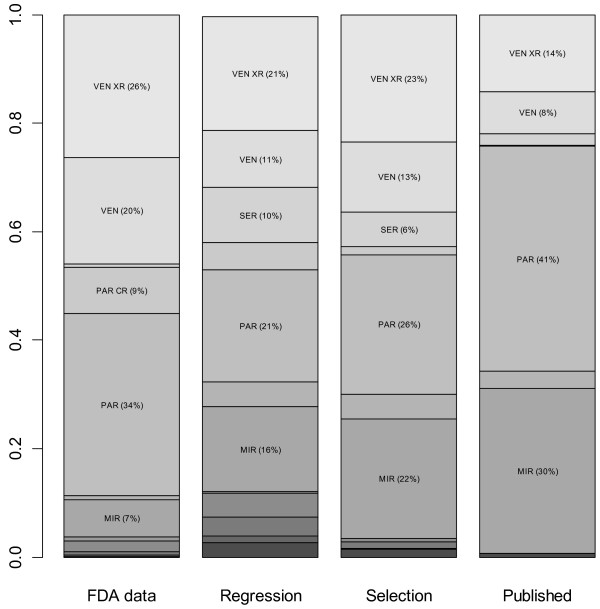
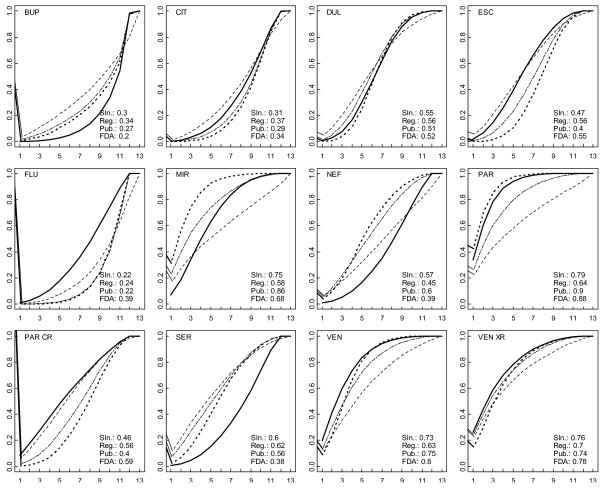
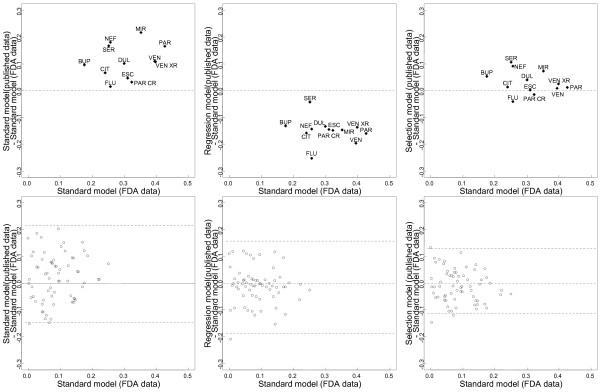
Methods: We introduced 2 adjustment models for Bayesian NMA. First, we extended a meta-regression model that allows the effect size to depend on its standard error. Second, we used a selection model that estimates the propensity of trial results being published and in which trials with lower propensity are weighted up in the NMA model. Both models rely on the assumption that biases are exchangeable across the network. We applied the models to 2 networks of placebo-controlled trials of 12 antidepressants, with 74 trials in the US Food and Drug Administration (FDA) database but only 51 with published results. NMA and adjustment models were used to estimate the effects of the 12 drugs relative to placebo, the 66 effect sizes for all possible pair-wise comparisons between drugs, probabilities of being the best drug and ranking of drugs. We compared the results from the 2 adjustment models applied to published data and NMAs of published data and NMAs of FDA data, considered as representing the totality of the data.

Results: Both adjustment models showed reduced estimated effects for the 12 drugs relative to the placebo as compared with NMA of published data. Pair-wise effect sizes between drugs, probabilities of being the best drug and ranking of drugs were modified. Estimated drug effects relative to the placebo from both adjustment models were corrected (i.e., similar to those from NMA of FDA data) for some drugs but not others, which resulted in differences in pair-wise effect sizes between drugs and ranking.

Conclusions: In this case study, adjustment models showed that NMA of published data was not robust to reporting bias and provided estimates closer to that of NMA of FDA data, although not optimal. The validity of such methods depends on the number of trials in the network and the assumption that conventional MAs in the network share a common mean bias mechanism.


Figures

Figure 1
Figure 1
Contour-enhanced funnel plots forthe antidepressant trials withpublished results. Each funnel plot is the scatter plot of the treatment effect estimates from individual trials against the associated standard errors; the vertical solid line represents the pooled estimate. In the absence of reporting bias, we might expect a symmetrical funnel plot. We may find the funnel plot is not symmetrical, ie does not resemble an inverted funnel, which may be due to reporting bias, however there are other possible sources of asymmetry. The contour lines represent perceived milestones of statistical significance (long dash p = 0.1; dash p = 0.05; short dash p = 0.01). If studies seem to be missing in areas of non-significance then asymmetry may be due to reporting bias rather than other factors.
Figure 2
Figure 2
Difference plots of estimatesof pair-wise comparisons ofthe 12 antidepressant agentsand placebo: regression modelof published data vs.standard network meta-analysis (NMA)model of published data(left panel); selection modelsof published vs. standardNMA model of publisheddata (right panel). The x-axes show the estimates from the standard NMA model applied to published data, the y-axes show the differences between the estimates from the adjustment (regression or selection) model of published data and the estimates from the standard NMA model of published data. Black dots are the 12 estimated drug effects relative to placebo; white dots are the 66 possible pair-wise comparisons between the 12 drugs.
Figure 3
Figure 3
Probabilities that each antidepressantdrug is the bestaccording to standard NMAof FDA data, regressionmodel, selection model orstandard NMA model ofpublished data.
Figure 4
Figure 4
Cumulative ranking probability plotsfor the 12 antidepressantagents from the standardNMA model applied toFDA data (bold solidline) and published data(bold dotted line) andfrom the 2 adjustmentmodels applied to publisheddata (regression model inplain dashed line andselection model in plaindouble-dashed line). On each plot, the x-axis shows possible ranks from r = 1 up to r = 13 and the y-axis shows the cumulative probabilities that the corresponding treatment is among the top r treatments. The closer the curve is to the upper left corner, the better the treatment. The surface under the cumulative ranking line is 1 when a treatment is the best and 0 when a treatment is the worst. FDA: standard NMA model applied to FDA data (bold plain line); Pub.: standard NMA model applied to published data (bold dash line); Reg.: regression model applied to published data (dash line); Sln.: selection model applied to published data (long-dash short-dash line).
Figure 5
Figure 5
Difference plots of estimatesof pair-wise comparisons ofthe 12 antidepressant agentsand placebo: standard NMAmodel of published datavs. standard NMA modelof FDA data (upperpanel); regression model ofpublished data vs. standardNMA model of FDAdata (bottom left panel);selection model of publishedvs. standard NMA modelof FDA data (bottomright panel). The x-axes show the estimates from the standard NMA model applied to FDA data, the y-axes show the differences between the estimates from the adjustment (regression or selection) model of published data and the estimates from the standard NMA model of FDA data. Black dots are the 12 estimated drug effects relative to placebo; white dots are the 66 possible pair-wise comparisons between the 12 drugs.

Similar articles

Cited by

References

    1. Lumley T. Network meta-analysis for indirect treatment comparisons. Stat Med. 2002;21(16):2313–2324. doi: 10.1002/sim.1201. - DOI - PubMed
    1. Lu G, Ades AE. Combination of direct and indirect evidence in mixed treatment comparisons. Stat Med. 2004;23(20):3105–3124. doi: 10.1002/sim.1875. - DOI - PubMed
    1. Salanti G, Higgins JPT, Ades AE, Ioannidis JPA. Evaluation of networks of randomized trials. Stat Methods Med Res. 2008;17(3):279–301. - PubMed
    1. Dwan K, Altman DG, Arnaiz JA, Bloom J, Chan AW, Cronin E, Decullier E, Easterbrook PJ, Von Elm E, Gamble C. et al.Systematic review of the empirical evidence of study publication bias and outcome reporting bias. PLoS One. 2008;3(8):e3081. doi: 10.1371/journal.pone.0003081. - DOI - PMC - PubMed
    1. Song F, Parekh S, Hooper L, Loke YK, Ryder J, Sutton AJ, Hing C, Kwok CS, Pang C, Harvey I. Dissemination and publication of research findings: an updated review of related biases. Health Technol Assess. 2010;14(8):193. - PubMed

Publication types

Substances