. 2012 Oct 30;51(43):8478-90.
doi: 10.1021/bi300574r. Epub 2012 Oct 16.

Ionic strength effects on amyloid formation by amylin are a complicated interplay among Debye screening, ion selectivity, and Hofmeister effects

Affiliations

Ionic strength effects on amyloid formation by amylin are a complicated interplay among Debye screening, ion selectivity, and Hofmeister effects

Peter J Marek et al. Biochemistry. .

Abstract

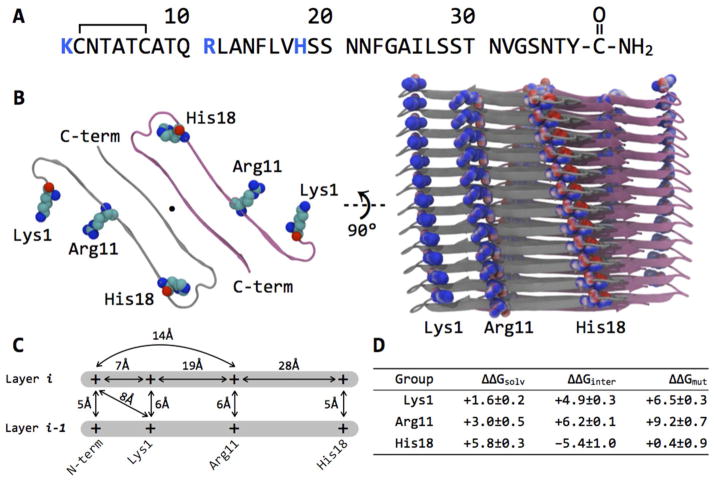
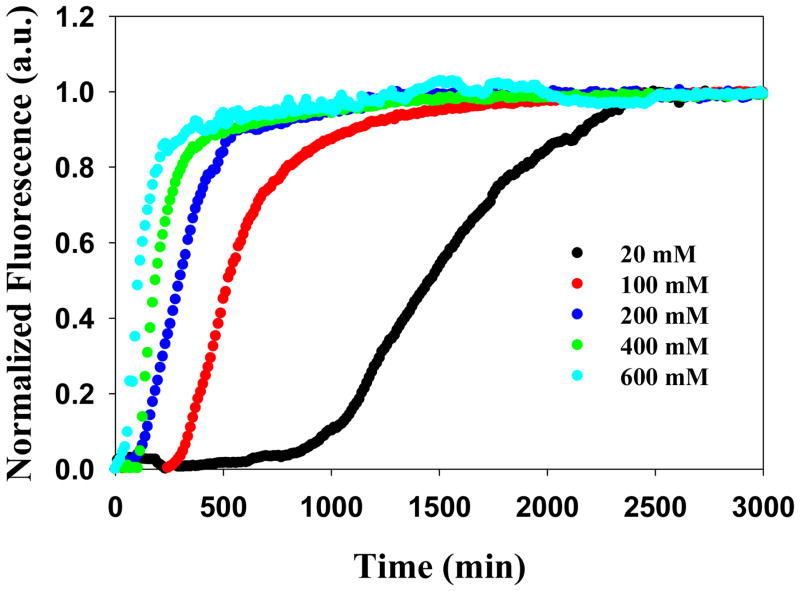
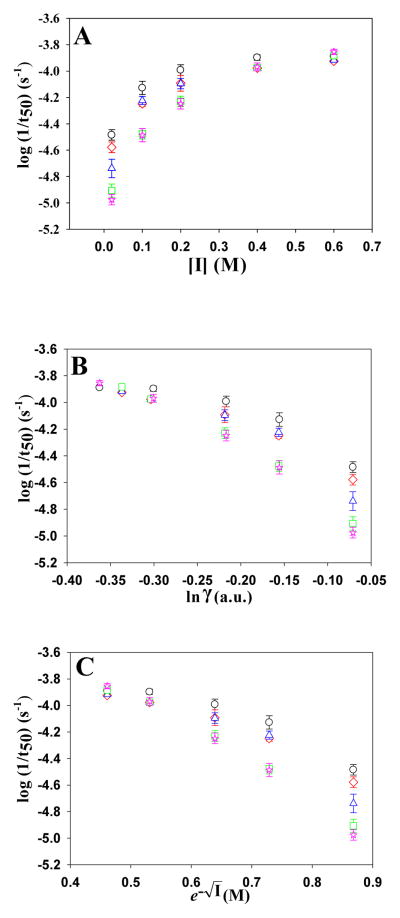
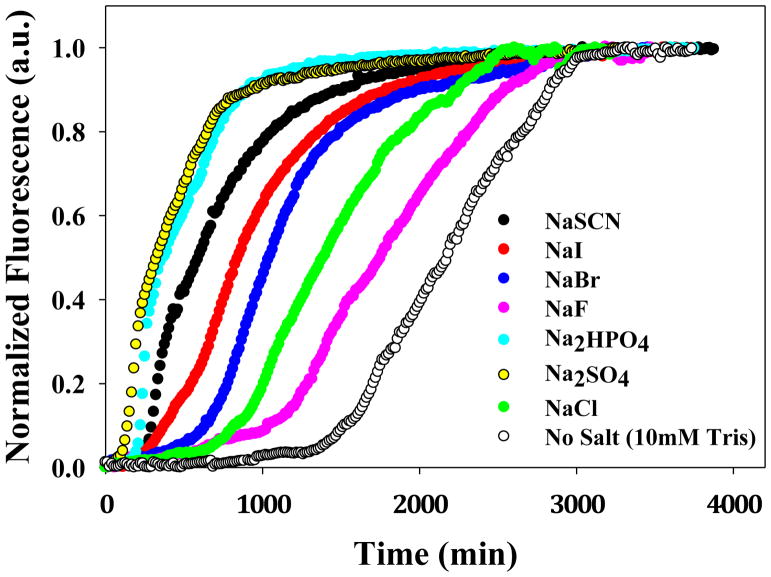
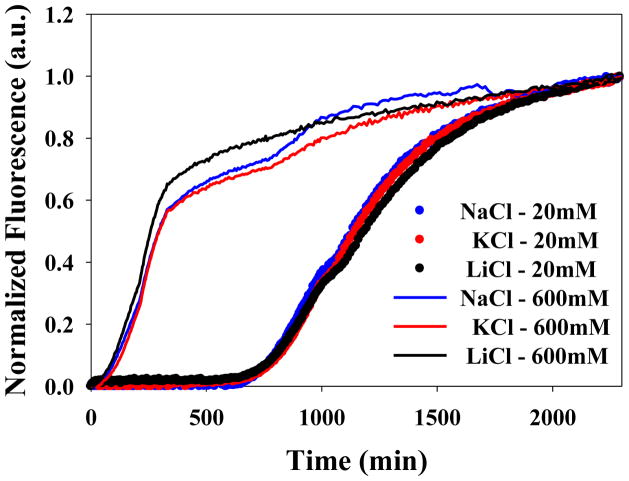
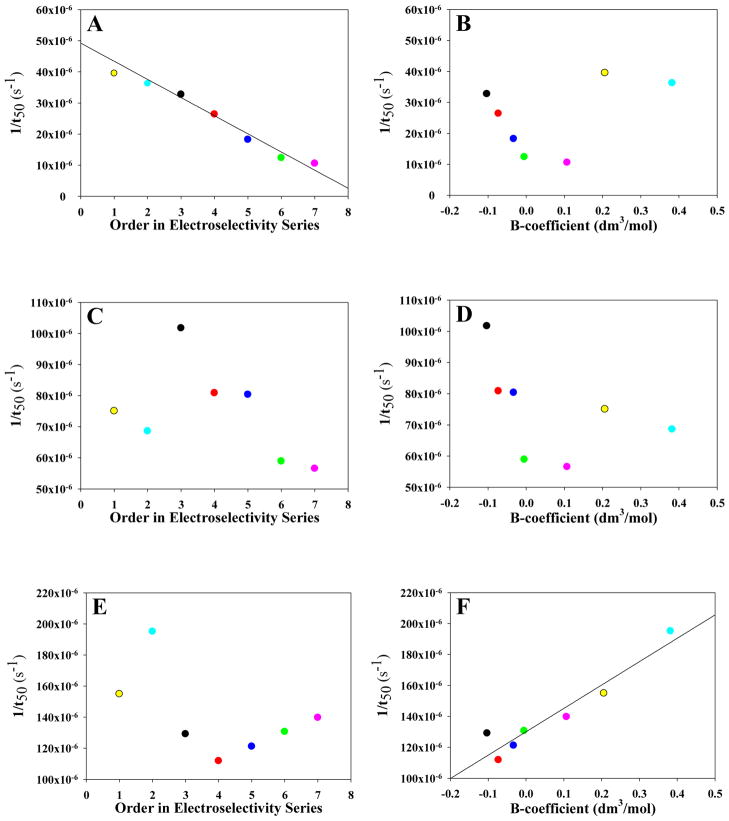
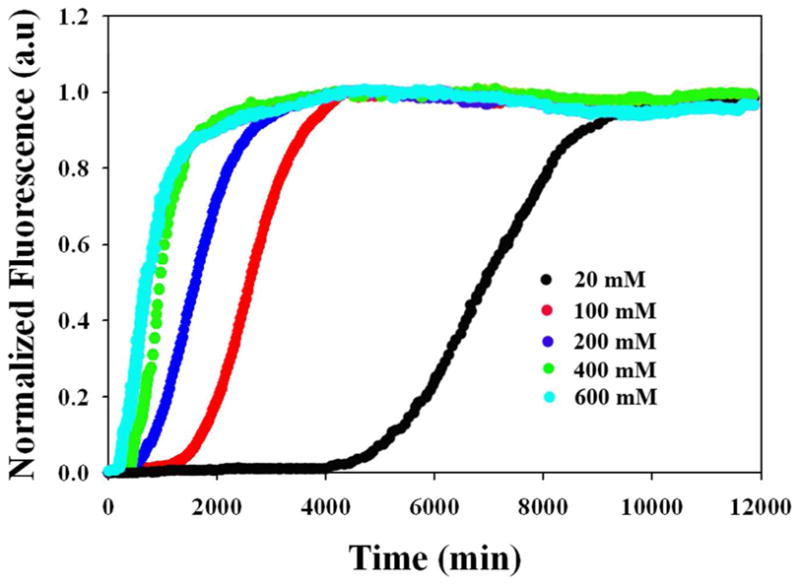
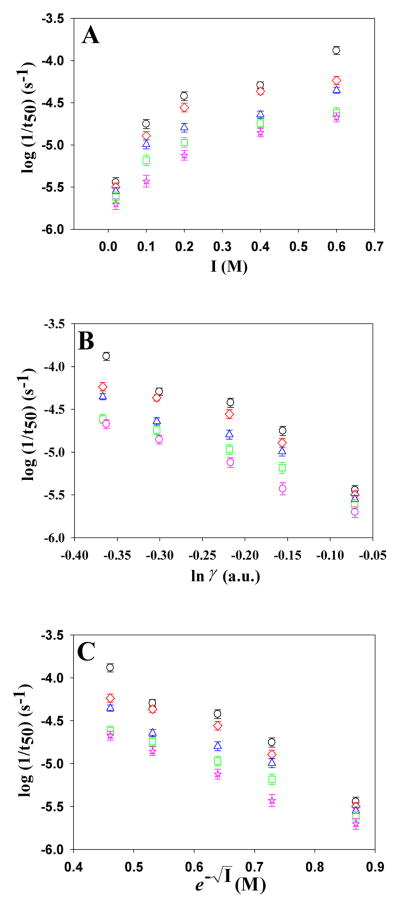
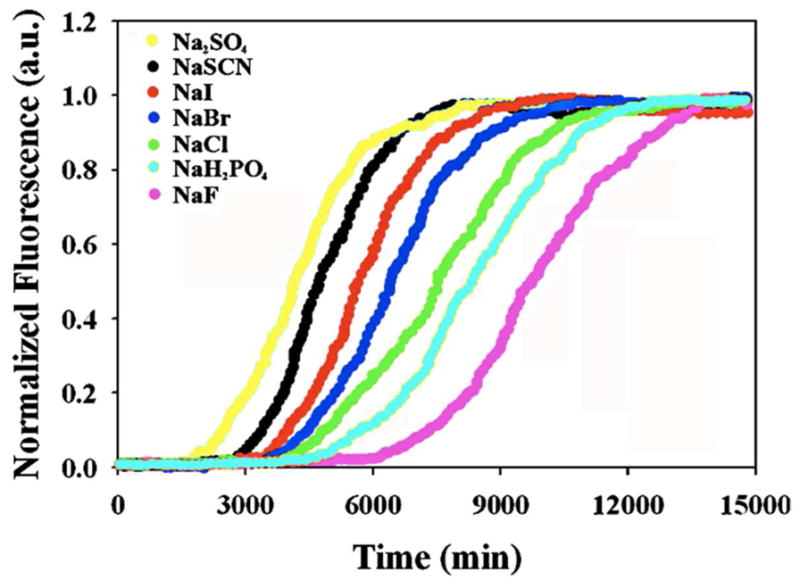
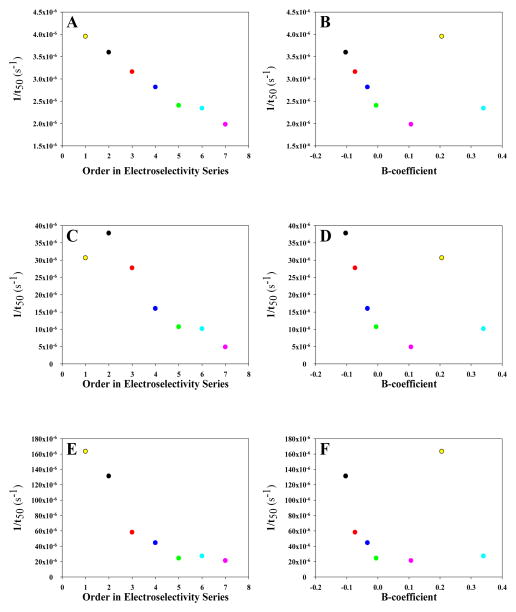
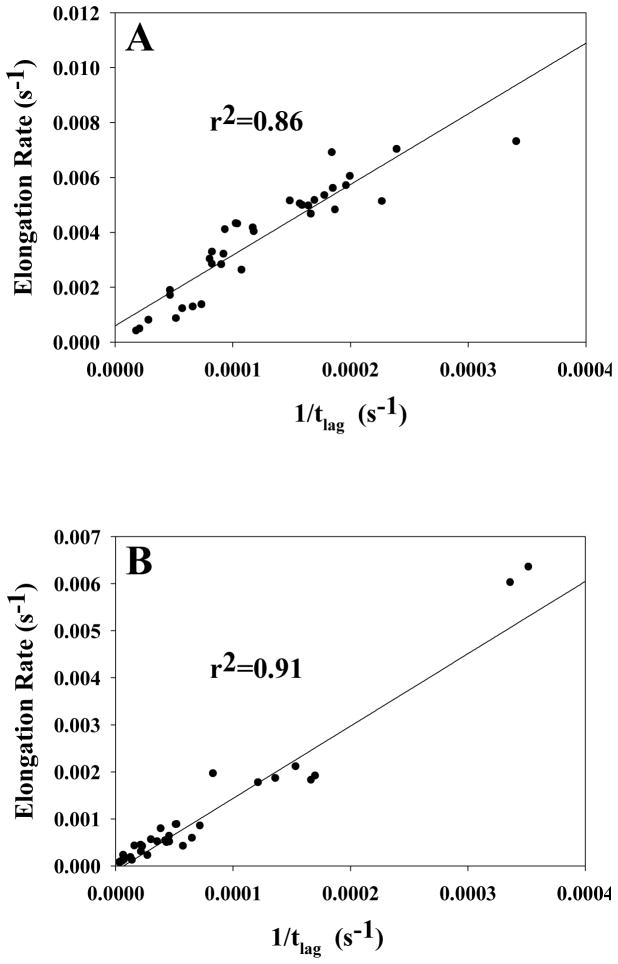
Amyloid formation plays a role in a wide range of human diseases. The rate and extent of amyloid formation depend on solution conditions, including pH and ionic strength. Amyloid fibrils often adopt structures with parallel, in-register β-sheets, which generate quasi-infinite arrays of aligned side chains. These arrangements can lead to significant electrostatic interactions between adjacent polypeptide chains. The effect of ionic strength and ion composition on the kinetics of amyloid formation by islet amyloid polypeptide (IAPP) is examined. IAPP is a basic 37-residue polypeptide responsible for islet amyloid formation in type 2 diabetes. Poisson-Boltzmann calculations revealed significant electrostatic repulsion in a model of the IAPP fibrillar state. The kinetics of IAPP amyloid formation are strongly dependent on ionic strength, varying by a factor of >10 over the range of 20-600 mM NaCl at pH 8.0, but the effect is not entirely due to Debye screening. At low ionic strengths, the rate depends strongly on the identity of the anion, varying by a factor of nearly 4, and scales with the electroselectivity series, implicating anion binding. At high ionic strengths, the rate varies by only 8% and scales with the Hofmeister series. At intermediate ionic strengths, no clear trend is detected, likely because of the convolution of different effects. The effects of salts on the growth phase and lag phase of IAPP amyloid formation are strongly correlated. At pH 5.5, where the net charge on IAPP is higher, the effect of different anions scales with the electroselectivity series at all salt concentrations.


Figures

Figure 1
Figure 1
(A) Primary sequence of human IAPP, with basic residues highlighted in blue. The polypeptide contains a disulfide bridge between residues 2 and 7 and has an amidated C-terminus. At physiological pH, the N-terminus is protonated and charged. (B) A model of the IAPP fiber, adapted from Sawaya and Eisenberg (51). Left, A view down the fibrillar axis (indicated by ●), with only a single layer shown for clarity. A layer consists of two molecules of IAPP, which interact through a dry “steric zipper” interface. With exception of His18 all basic groups are solvent-exposed; in the model of Sawaya and Eisenberg, His18 points inside the core. Right, The proposed supermolecular structure of the IAPP fiber. Twelve layers stacked on top of one another are shown, at an interval of 7.2 Å; the layers are arranged with a super-helical twist. Basic groups are shown in space-filling repserentation, and their heavy atoms are color-coded from red to blue (−20 to +20 kbT/ec units) according to the electrostatic potential calculated using APBS (53). The basic groups align with those in the layers above and below, and there is a preponderance of positive charge near the N-terminus. The molecular structures were rendered using VMD (54). (C) A schematic of calculated pairwise distances between the basic groups in the assembled IAPP fibril derived from the MD ensemble. Average distances are given; standard deviations of all measurements are below 2 Å. Two layers are displayed; the fibril continues vertically above layer i and below layer i−1. Please note that the distances are not drawn to scale. (D) Summary of the average Poisson–Boltzmann electrostatic contributions of Lys1, Arg11, and His18 side chains to protein stability. All values are in kcal mol−1.
Figure 2
Figure 2
Dependence of the kinetics of amyloid formation on the ionic strength for various concentrations of NaCl at pH 8.0. Plots of thioflavin-T fluorescence intensity versus time are displayed. The concentration of added NaCl ranged from 20 to 600 mM. All experiments were conducted at 25 °C, pH 8.0 and all samples contained 10 mM Tris-HCl. The concentration of IAPP and thioflavin-T were both 32 μM.
Figure 3
Figure 3
Analysis of the dependence of log(1/t50) on ionic strength, I, for the monovalent anions at pH 8.0. The observed values of log(1/t50) are plotted vs. (A) I; (B) ln(γ); (C) e−√I Black circles, NaSCN; Red diamonds, NaI; Blue triangles, NaBr; Green squares, NaCl; Pink stars, NaF. The error bars represent the apparent standard deviation from three separate kinetic runs.
Figure 4
Figure 4
Dependence of the kinetics of amyloid formation on the anion identity at 20 mM added salt (30 mM ionic strength) at pH 8.0. Plots of thioflavin-T fluorescence intensity versus time are displayed. All experiments were conducted at 25 °C, pH 8.0 and all samples contained 10 mM Tris-HCl. The concentration of IAPP and thioflavin-T were both 32 μM.
Figure 5
Figure 5
The identity of the cation has little effect on the kinetics of amyloid formation. Thioflavin-T curves are shown at 20 mM and 600 mM added salt for NaCl, KCl and LiCl. Experiments were conducted at pH 8.0.
Figure 6
Figure 6
The rank order of the effects of different anions on the rate (1/t50) of amyloid formation at pH 8.0 at 20 (A and B), 200 (C and D) and 600 mM (E and F) added salt versus their order in the electroselectivity series (A, C and E) and the Hofmeister series (B, D and F). Note that the vertical axis scale is different for the different ionic strengths. At 20 mM added salt the order of the rate of amyloid formation for the anions scales with their order in the electroselectivity series (A), but not with the Jones–Dole B-coefficient (B). At 200 mM added salt the strictly-linear trend disappears for both the electroselectivity series (C) and Hofmeister series (D), presumably from competing effects between the forces involved from each effect. At high ionic strength, 600 mM added salt, the on amyloid formation scaled with the Hofmeister series (F), but not the electroselectivity series (E). Interestingly, we observe strong linear correlations at all ionic stengths for when only the monovalent salts are considered. Black, NaSCN; Red, NaI; Blue, NaBr; Green, NaCl; Pink, NaF; Yellow, Na2SO4; Cyan, Na2HPO4. All samples contained 10 mM Tris-HCl in addition to the added salt.
Figure 7
Figure 7
Salts induce amyloid formation, not amorphous precipitates. All samples were collected at the end of the kinetic assays and contain 10 mM Tris-HCl, pH 8.0. (A) No added salt (B) 20 mM NaSCN, (C) 600 mM NaSCN, (D) 20 mM NaI, (E) 600 mM NaI, (F) 20 mM NaBr, (G) 600 mM NaBr, (H) 20 mM NaCl, (I) 600 mM NaCl, (J) 20 mM NaF, (K) 600 mM NaF, (L) 20 mM Na2SO4, (M) 600 mM Na2SO4, (N) 20 mM Na2HPO4, (O) 600 mM Na2HPO4. Scale bar is 100 nm.
Figure 8
Figure 8
Dependence of the kinetics of amyloid formation at pH 5.5 on the ionic strength for various concentrations of NaCl. Plots of thioflavin-T fluorescence intensity versus time are displayed. The concentration of added NaCl ranged from 20 to 600 mM. All experiments were conducted at 25 °C, pH 5.5 and all samples contained 10 mM MES. The concentration of IAPP and thioflavin-T were both 32 μM.
Figure 9
Figure 9
Analysis of the dependence of log(1/t50) on ionic strength, I, for the monovalent anions at pH 5.5. The observed values of log(1/t50) are plotted vs. (A) I; (B) ln(γ); (C) e−√I. Black circles, NaSCN; Red diamonds, NaI; Blue triangles, NaBr; Green squares, NaCl; Pink stars, NaF. The error bars represent the apparent standard deviation from three separate kinetic runs.
Figure 10
Figure 10
Dependence of the kinetics of amyloid formation on the anion identity at 20 mM added salt (30 mM ionic strength) at pH 5.5. Plots of thioflavin-T fluorescence intensity versus time are displayed. All experiments were conducted at 25 °C, pH 5.5 and all samples contained 10 mM MES. The concentration of IAPP and thioflavin-T were both 32 μM.
Figure 11
Figure 11
The rank order of the effects of different anions on the rate (1/t50) of amyloid formation at pH 5.5 at 20 (A and B), 200 (C and D) and 600 mM (E and F) added salt versus their order in the electroselectivity series (A, C and E) and the Hofmeister series (B, D and F). At 20 mM added salt the order of the rate of amyloid formation for the anions scales with their order in the electroselectivity series (A), but not with the Jones–Dole B-coefficient (B). At 200 mM added salt the strictly-linear trend disappears for both the electroselectivity series (C) and Hofmeister series (D), presumably from competing effects between the forces involved from each effect. At high ionic strength, 600 mM added salt, the effect on amyloid formation scaled with the Hofmeister series (F), but not the electroselectivity series (E). Interestingly, we observe strong linear correlations at all ionic stengths for when only the monovalent salts are considered. Black, NaSCN; Red, NaI; Blue, NaBr; Green, NaCl; Pink, NaF; Yellow, Na2SO4; Cyan, Na2HPO4. All samples contained 10 mM MES.
Figure 12
Figure 12
Correlation of the rate at t50, vmax, with 1/tlag for all anions at all ionic strengths at (A) pH 8.0 and (B) pH 5.5. The kinetic parameters are derived from the thioflavin-T kinetic assays fit to Equation 1. The data are fit to a straight line with an r2 of 0.86 (p = 0.03) and 0.91 (p = 0.04) for pH 8.0 and pH 5.5, respectively.

Similar articles

Cited by

References

    1. Abedini A, Raleigh DP. Destabilization of human IAPP amyloid fibrils by proline mutations outside of the putative amyloidogenic domain: is there a critical amyloidogenic domain in human IAPP. J Mol Biol. 2006;355:274–281. - PubMed
    1. Maurer-Stroh S, Debulpaep M, Kuemmerer N, Lopez M, Martins I, Reumers J, et al. Exploring the sequence determinants of amyloid structure using position-specific scoring matrices. Nat Methods. 2010;7:237–242. - PubMed
    1. Moriarty DF, Raleigh DP. Effects of sequential proline substitutions on amyloid formation by human amylin 20–29. Biochemistry (Mosc) 1999;38:1811–1818. - PubMed
    1. Nerelius C, Fitzen M, Johansson J. Amino acid sequence determinants and molecular chaperones in amyloid fibril formation. Biochem Biophys Res Comm. 2010;396:2–6. - PubMed
    1. Tjernberg L, Hosia W, Bark N, Thyberg J, Johansson J. Charge attraction and beta propensity are necessary for amyloid fibril formation from tetrapeptides. J Biol Chem. 2002;277:43243–43246. - PubMed

Publication types