

Predicting resource utilization of elderly burn patients in the baby boomer era
- PMID: 23017253
- PMCID: PMC4010937
- DOI: 10.1016/j.amjsurg.2012.05.002
Predicting resource utilization of elderly burn patients in the baby boomer era
Abstract
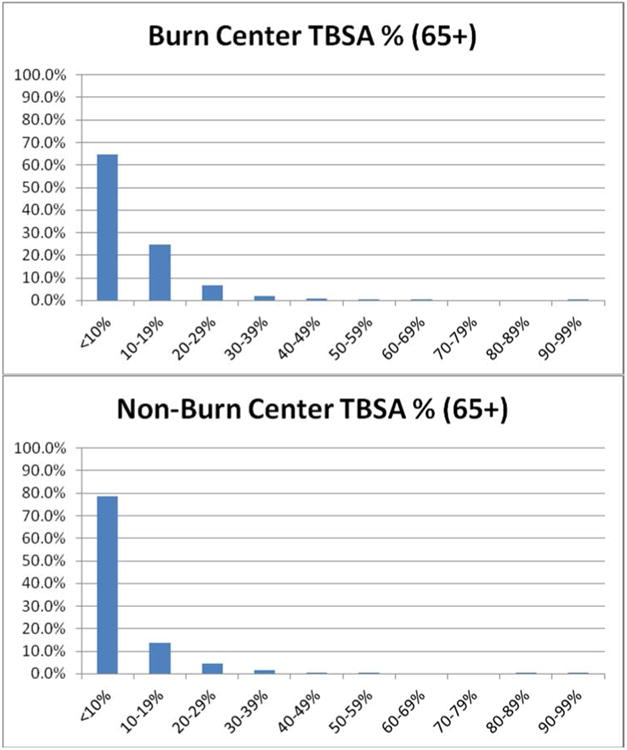
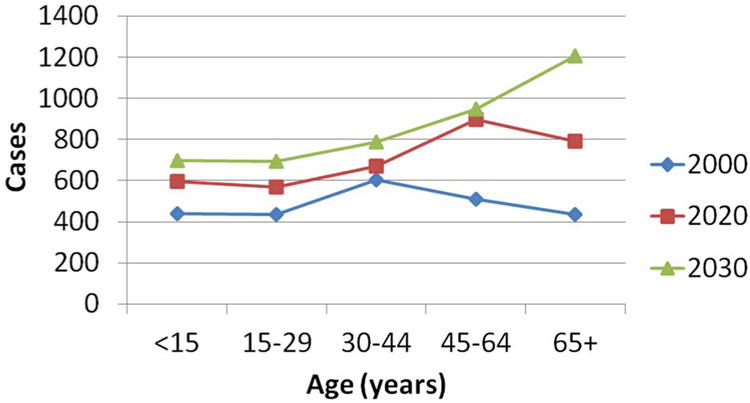
Background: Census predictions for Florida suggest a 3-fold increase in the 65 and older population within 20 years. We predict resource utilization for burn patients in this age group.
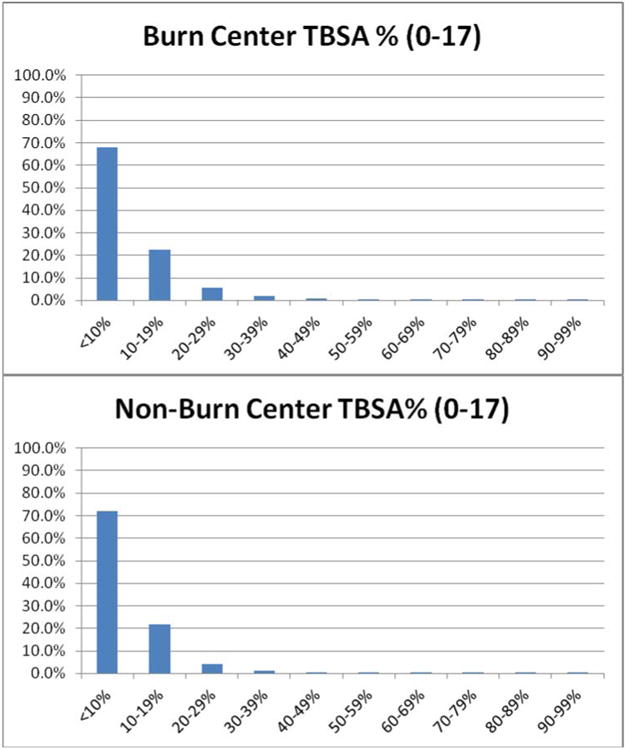
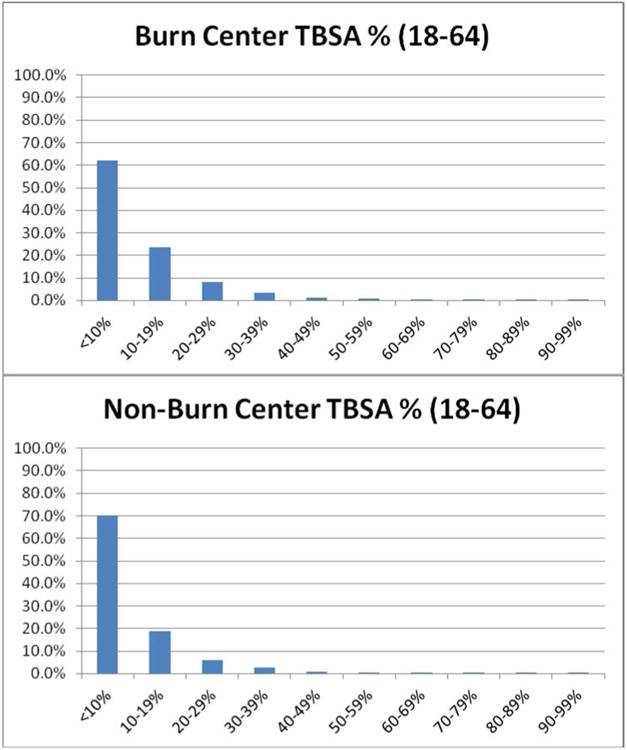
Methods: Using the Florida Agency for Healthcare Administration admission dataset, we evaluated the effect of age on length of stay, hospital charges, and discharge disposition while adjusting for clinical and demographic factors. Using US Census Bureau data and burn incidence rates from this dataset, we estimated future resource use.
Results: Elderly patients were discharged to home less often and were discharged to short-term general hospitals, intermediate-care facilities, and skilled nursing facilities more often than the other age groups (P < .05). They also required home health care and intravenous medications significantly more often (P < .05). Their length of stay was longer, and total hospital charges were greater (P < .05) after adjusting for sex, race, Charleson comorbidity index, payer, total body surface area burned, and burn center treatment.
Conclusions: Our data show an age-dependent increase in the use of posthospitalization resources, the length of stay, and the total charges for elderly burn patients.
Copyright © 2013 Elsevier Inc. All rights reserved.
Figures
References
-
- Population Pyramids of Florida. US Census Bureau, Population Division, Interim State Population Projections, 2005 Internet Release Date. 2005 Apr 21;
-
- National Center For Injury Prevention and Control. CDC, NEISS All Injury Program, Consumer Product Safety Commission. 20 leading Causes of Non-fatal Injury, US. 2008
-
- Anous MM, Heimbach DM. Causes of Death and Predictors in Burned Patients More than 60 Years of Age. The Journal of Trauma. 1986;26(2):135–139. - PubMed
-
- Renz BM, Sherman R. The Burn Unit Experience at Grady Memorial Hospital: 844 Cases. J Burn Care Rehabil. 1992;13:426–436. - PubMed
MeSH terms
Grants and funding
LinkOut - more resources
Full Text Sources
Other Literature Sources
Medical
