. 2012 Sep-Oct;4(5):343-8.
doi: 10.4161/isl.22283. Epub 2012 Sep 1.

Increased expression of adenylyl cyclase 3 in pancreatic islets and central nervous system of diabetic Goto-Kakizaki rats: a possible regulatory role in glucose homeostasis

Affiliations

Increased expression of adenylyl cyclase 3 in pancreatic islets and central nervous system of diabetic Goto-Kakizaki rats: a possible regulatory role in glucose homeostasis

Mohammed Seed Ahmed et al. Islets. 2012 Sep-Oct.

Abstract

Adenylyl cyclase 3 (AC3) is expressed in pancreatic islets of the Goto-Kakizaki (GK) rat, a spontaneous animal model of type 2 diabetes (T2D), and also exerts genetic effects on the regulation of body weight in man. In addition to pancreatic islets, the central nervous system (CNS) plays an important role in the pathogenesis of T2D and obesity by regulating feeding behavior, body weight and glucose metabolism. In the present study, we have investigated AC3 expression in pancreatic islets, striatum and hypothalamus of GK rats to evaluate its role in the regulation of glucose homeostasis. GK and Wistar rats at the age of 2.5 mo were used. A group of GK rats were implanted with sustained insulin release chips for 15 d. Plasma glucose and serum insulin levels were measured. AC3 gene expression levels in pancreatic islets, striatum and hypothalamus were determined by using real-time RT-PCR. Results indicated that plasma glucose levels in Wistar rats were found to be similar to insulin-treated GK rats, and significantly lower compared with non-treated GK rats. AC3 expression levels in pancreatic islets, striatum and hypothalamus of GK rats were higher compared with Wistar rats, while the levels were intermediate in insulin-treated GK rats. The AC3 expression display patterns between pancreatic islets and striatum-hypothalamus were similar. The present study thus provides the first evidence that AC3 is overexpressed in the regions of striatum and hypothalamus of brain, and similarly in pancreatic islets of GK rats suggesting that AC3 plays a role in regulation of glucose homeostasis via CNS and insulin secretion.


Figures

None
Figure 1. Serial measurement of plasma glucose levels in GK, insulin-treated GK and Wistar rats. n = 11, 11 and 14 for GK, insulin-treated GK, and Wistar rats, respectively. Data were means ± SE.
None
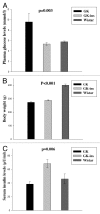
Figure 2. Plasma glucose levels (A), body weight (B) and serum insulin levels (C) of GK, insulin-treated GK and Wistar rats at sacrifice. (A)Plasma glucose levels in GK rats (n = 11) were higher compared with GK rats with insulin treatment (n = 11, p = 0.005) and Wistar rats (n = 14, p = 0.008). There was no difference between insulin-treated GK and Wistar rats; (B) Body weights in Wistar rats were higher than in GK rats with and without insulin treatment (p < 0.001). Body weights of GK and insulin-treated GK rats were similar; (C) GK rats with insulin treatment had increased serum insulin levels compared with GK rats without insulin treatment (p = 0.006) and also to Wistar rats (p = 0.035). Data were means ± SE; p values were from ANOVA analyses among GK, insulin-treated GK and Wistar rats. Pairwise comparisons were performed with Tukey post-hoc test.
None
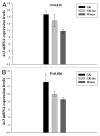
Figure 3.AC3 mRNA expression levels in pancreatic islets (A) and striatum-hypothalamus regions of brain (B). AC3 mRNA expression levels in both pancreatic islets and striatum-hypothalamus regions of brain of GK rats were significantly upregulated compared with Wistar rats (p = 0.016, 0.021, respectively). AC3 expression levels in both pancreatic islets and striatum-hypothalamus regions of brain of insulin-treated GK rats were relatively decreased compared with GK rats without insulin treatment but still higher than in Wistar rats. Data were means ± SE; P-values were from ANOVA analyses among GK, insulin-treated GK and Wistar rats. Pairwise comparisons were performed with Tukey post-hoc test.
None
Figure 4.AC3 (above) and RGS9 (below) mRNA expression levels in striatum and hypothalamus regions of brain of RGS9 knockout and wild-type mice. AC3 mRNA expression levels in both striatum and hypothalamus regions of brain were similar in RGS9 knockout and wild-type mice. RGS9 was expressed in striatum and hypothalamus regions of brain of wild-type but not in RGS9 knockout mice (p < 0.001). Data were means ± SE; P-values were from student t-test.

References

    1. Amed S, Daneman D, Mahmud FH, Hamilton J. Type 2 diabetes in children and adolescents. Expert Rev Cardiovasc Ther. 2010;8:393–406. doi: 10.1586/erc.10.15. - DOI - PubMed
    1. Marchetti P, Lupi R, Del Guerra S, Bugliani M, Marselli L, Boggi U. The beta-cell in human type 2 diabetes. Adv Exp Med Biol. 2010;654:501–14. doi: 10.1007/978-90-481-3271-3_22. - DOI - PubMed
    1. Polakof S. Diabetes therapy: novel patents targeting the glucose-induced insulin secretion. Recent Pat DNA Gene Seq. 2010;4:1–9. doi: 10.2174/187221510790410778. - DOI - PubMed
    1. Umegaki H. Neurodegeneration in diabetes mellitus. Adv Exp Med Biol. 2012;724:258–65. doi: 10.1007/978-1-4614-0653-2_19. - DOI - PubMed
    1. McCrimmon RJ. Update in the CNS response to hypoglycemia. J Clin Endocrinol Metab. 2012;97:1–8. doi: 10.1210/jc.2011-1927. - DOI - PubMed

Publication types