. 2012 Dec;108(12):3353-69.
doi: 10.1152/jn.00414.2011. Epub 2012 Sep 26.

Effects of spatiotemporal stimulus properties on spike timing correlations in owl monkey primary somatosensory cortex

Affiliations

Effects of spatiotemporal stimulus properties on spike timing correlations in owl monkey primary somatosensory cortex

Jamie L Reed et al. J Neurophysiol. 2012 Dec.

Abstract

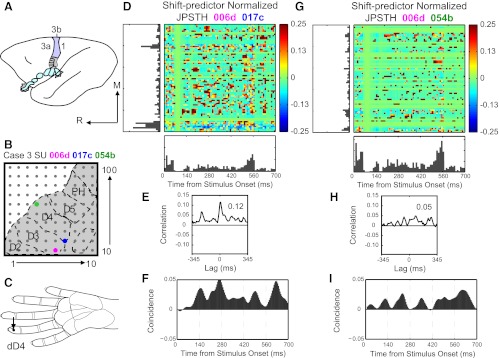
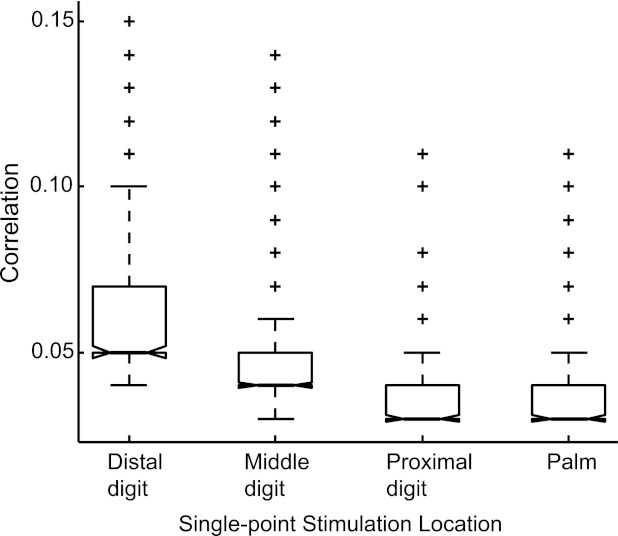
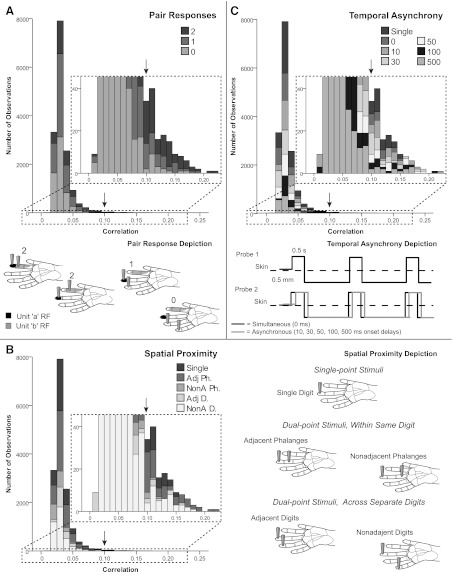
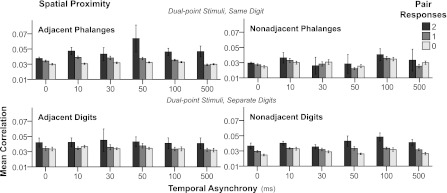
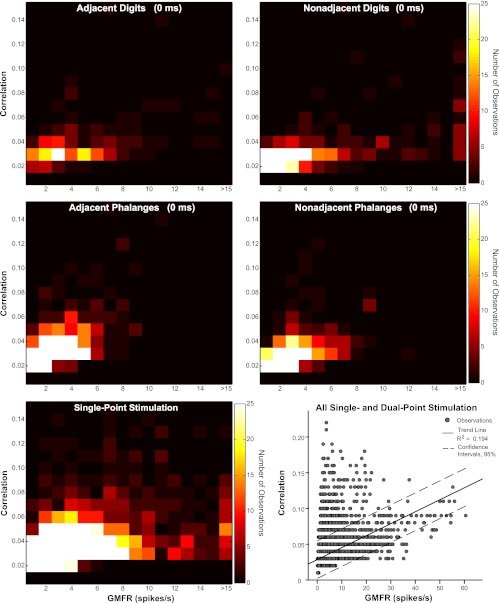
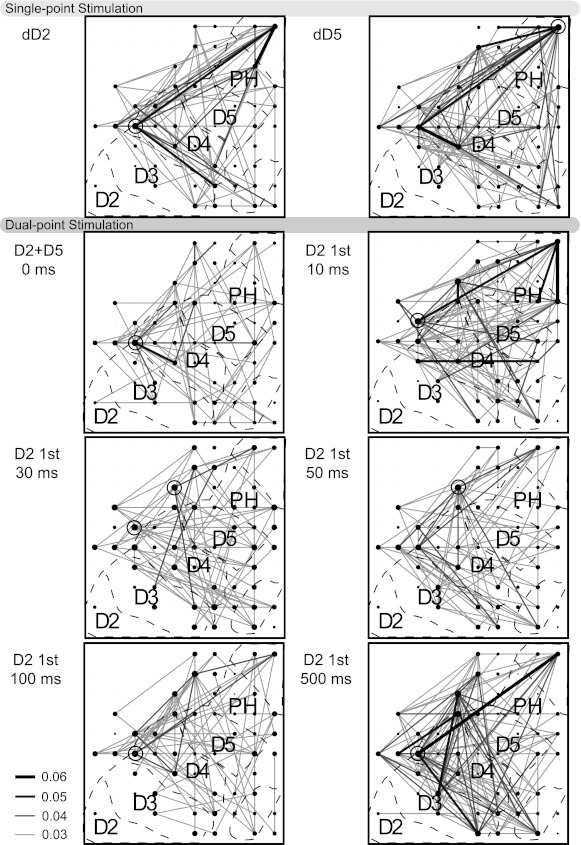
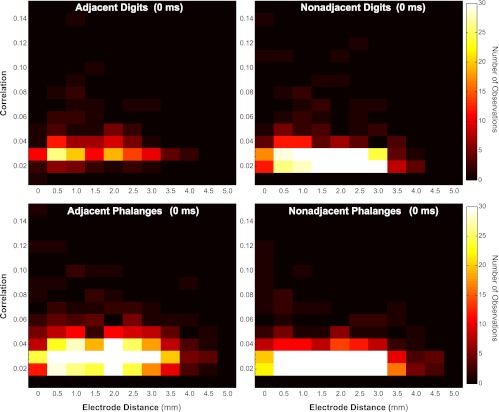
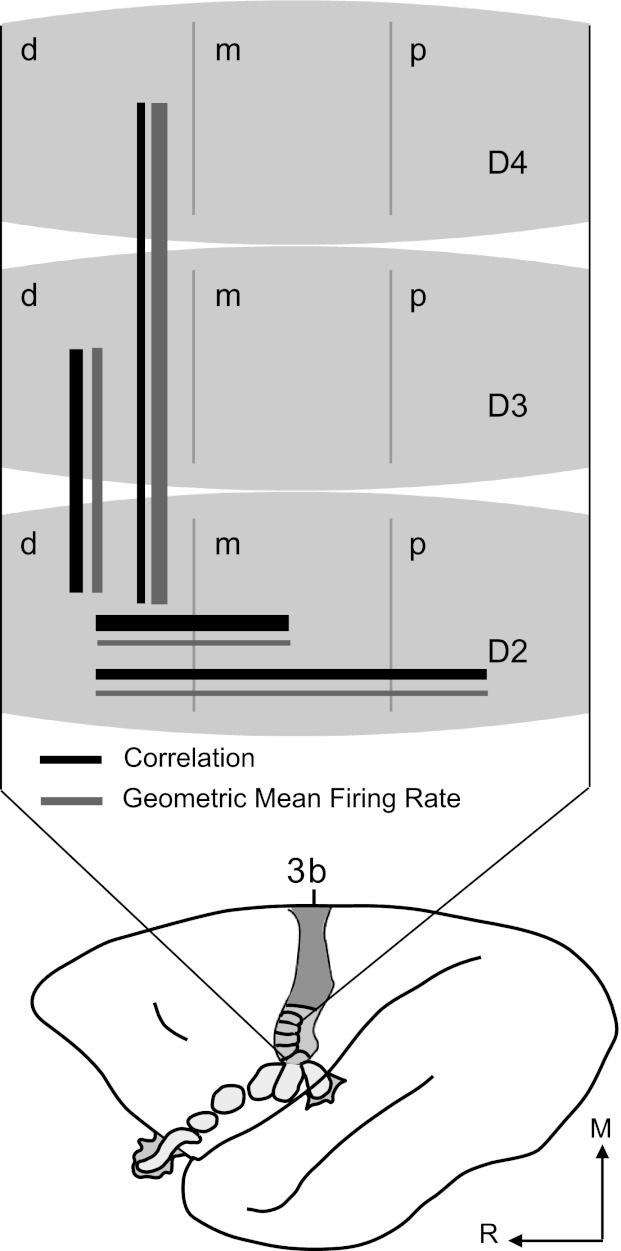
The correlated discharges of cortical neurons in primary somatosensory cortex are a potential source of information about somatosensory stimuli. One aspect of neuronal correlations that has not been well studied is how the spatiotemporal properties of tactile stimuli affect the presence and magnitude of correlations. We presented single- and dual-point stimuli with varying spatiotemporal relationships to the hands of three anesthetized owl monkeys and recorded neuronal activity from 100-electrode arrays implanted in primary somatosensory cortex. Correlation magnitudes derived from joint peristimulus time histogram (JPSTH) analysis of single neuron pairs were used to determine the level of spike timing correlations under selected spatiotemporal stimulus conditions. Correlated activities between neuron pairs were commonly observed, and the proportions of correlated pairs tended to decrease with distance between the recorded neurons. Distance between stimulus sites also affected correlations. When stimuli were presented simultaneously at two sites, ∼37% of the recorded neuron pairs showed significant correlations when adjacent phalanges were stimulated, and ∼21% of the pairs were significantly correlated when nonadjacent digits were stimulated. Spatial proximity of paired stimuli also increased the average correlation magnitude. Stimulus onset asynchronies in the paired stimuli had small effects on the correlation magnitude. These results show that correlated discharges between neurons at the first level of cortical processing provide information about the relative locations of two stimuli on the hand.


Figures

Fig. 1.
Fig. 1.
Examples of normalized joint peristimulus time histograms (JPSTH) reveal reliable correlations in spike timing between neuron pairs. A: schematic of owl monkey brain shown with area 3b highlighted in color and hand representation shaded gray. M, medial; R, rostral. B: estimated location of 100-electrode array for case 3 shown with representations of digits (D2–D5) and palm including the hypothenar (PH) pads outlined. Colored dots mark electrodes where single units 006d (pink), 017c (blue), and 054b (green) were recorded. C: arrow points to stimulation location (distal D4, dD4) on hand schematic for results in D–I. D: strong spike timing correlations between 006d and 017c revealed in normalized JPSTH. Color code represents magnitude of normalized correlation. E: correlation histogram derived from normalized JPSTH shows spike times correlated with peak magnitude of 0.12 (shift-predictor correction already applied). F: coincidence histogram shows dynamics of the normalized correlation over the stimulus presentation time. G: weaker spike timing synchrony revealed in normalized JPSTH and correlation histogram (H) between 006d and 054b, which are farther apart in cortex than 006d and 017c. I: coincidence histogram rises variably throughout stimulus duration.
Fig. 2.
Fig. 2.
Correlation magnitude variations across stimulus locations. Single-point stimulation locations were grouped (x-axis) and normalized peak correlation values (y-axis) are shown in box plots to determine if stimulation location affected correlation magnitudes. Each group consists of the top 300 rank-ordered normalized correlation values for distal digit, middle digit, proximal digit, or palm locations. Solid horizontal line indicates median in each group. Above the median line is the upper quadrant of the sample, dashed whiskers indicate the range, and plus signs (+) indicate outliers. Box plots are ordered by rank such that distal digits had highest rank and palm had lowest rank.
Fig. 3.
Fig. 3.
Frequency-distribution histograms for spatiotemporal stimulus relationships. Stacked frequency-distribution histograms show that the majority of observations for all categories had correlation magnitudes between 0.03 and 0.04. Insets marked by dotted lines show close-up of the low frequencies of occurrence. Arrows point to correlation value 0.10 on full-size and inset charts to aid orientation. A, top: for the pair response category, all response categories (0–2) occurred throughout the distribution, even at the high-magnitude correlation tail, but the highest magnitude correlations occurred when pair response = 2. Bottom, pair response schematic depicts possible configurations of stimulation probes in relation to neurons' receptive fields (RFs) for hypothetical units a and b, to categorize pair response relations. When pair response = 2, two types of relationships are possible: RFs of the units can be close in proximity and the stimulus probes can be close in proximity, and both units respond to stimulation; or one stimulus probe is within the RF of one unit while the second probe is in the RF of the second unit. B, left: for the frequency distribution of spatial proximity of stimulus probes, all spatial categories were distributed throughout, even at the high magnitude correlation tail. The highest magnitude correlations were observed when a dual-point stimulus was located on adjacent phalanges (Adj Ph). Adj Ph = 2 probes in the same finger on adjacent phalanges; NonA Ph = 2 probes within same finger on nonadjacent phalanges; Adj D = 2 probes on different, adjacent fingers; and NonA D = 2 probes on different fingers separated by 1 or more digits. Right, spatial proximity schematic illustrates categories for the spatial configuration of the stimulus probes. C, top: for the frequency distribution of temporal asynchrony of stimuli, the high-magnitude correlation tail included all temporal categories, with no clear trends relating to the highest magnitudes. Bottom, temporal asynchrony depiction of stimulation pattern. Solid lines indicate indentation on the skin. Paired stimulation, indicated by probes 1 and 2, may be simultaneous or asynchronous. Two probes are presented to different skin sites; however, the gray solid line (probe 2) shifted relative to the black line depicts overlap in contact time of probes 1 and 2.
Fig. 4.
Fig. 4.
Mean correlation magnitudes across dual-point spatiotemporal stimulation conditions. Bar graphs show mean correlation magnitudes (y-axis) with simultaneous (0 ms) and asynchronous stimulation at 10-, 30-, 50-, 100-, and 500- ms delays (x-axis). Shaded bars indicate pair responses, and separate panels designate spatial proximity of stimulation sites (see Fig. 3). Error bars = 95% confidence intervals. Stimulus factors interacted to contribute to differences in correlation magnitudes, because the patterns are not replicated in the same directions across each condition.
Fig. 5.
Fig. 5.
Relationship of correlation magnitudes with average firing rates. Peak correlation magnitudes vs. geometric mean firing rate (GMFR; spikes/s) of neurons in correlated pairs are shown in heat maps generated from scatter plots for single-point stimulation and simultaneous (0 ms) dual-point stimulation. Color scale applies to all maps and indicates frequency of neuron pair observations. Stimulus conditions shown are representative of the full set of results. Scatter plot shows data set (15,662 observations) with trend line (solid) indicating the weak relationship between correlation magnitude and GMFR overall (R2 = 0.194). Dotted lines represent 95% confidence intervals.
Fig. 6.
Fig. 6.
Depiction of correlations between neuron pairs during spatiotemporal stimulations. Stimuli were presented to distal digit 2 (dD2) and 5 (dD5) individually in blocks of 100 trials for monkey 3. These locations were stimulated simultaneously and asynchronously with dD2 stimulation preceding dD5. Black dots indicate electrode sites from which single neurons were recorded. Significant correlations represented by lines connecting the dots. Dot size indicates magnitude of the sum of all correlations with that neuron. Open circles surround dots that represent neurons with the highest magnitude of summed correlations. Shade and thickness of lines represent magnitude of correlations (see key). When correlations are not reliable, no lines are shown, but dot sizes increase to indicate which electrodes recorded single neurons during the stimulation (multi-unit activity = pinpoint dots). Overlay of approximate locations in area 3b is indicated by dashed lines. Networks of correlations were largely stable regardless of stimulus parameters, with a notable exception of reduced correlations when distant digits were stimulated simultaneously.
Fig. 7.
Fig. 7.
Relationship between correlation magnitude and distance between electrode pairs. Magnitudes of significant correlations plotted (y-axis) on the basis of geometric distance between electrode pairs from which the activity was recorded (x-axis) for each of the dual-point (0 ms) spatial proximity categories are shown in heat maps. Color scale applies to all plots and indicates number of neuron pairs observed. Generally, stronger correlations were found between neurons located on nearby electrodes, but correlations were found between neuron pairs separated by more than 4 mm, especially when 2 sites within 1 digit were stimulated.
Fig. 8.
Fig. 8.
Summary of interactions within hand representation based on correlations and average firing rates. Schematic of owl monkey brain shows area 3b organization. Part of the hand representation is schematized and enlarged to summarize correlation and firing rate results. Digits are divided into distal (d), middle (m), and proximal (p) sections to represent phalanges within each digit. Solid black lines represent relationships between parts of the area 3b hand representation based on the magnitudes of correlations and proportions of correlated neuron pairs. Solid gray lines indicate relationships based on magnitudes of GMFR of correlated pairs. Line thickness approximates relative magnitudes within each category for spatial proximity of paired, dual-point stimuli. Relative strength of correlations between neurons did not strictly follow average firing rates of those neurons when different parts of the hand were stimulated.

Similar articles

Cited by

References

    1. Aertsen AMHJ, Gerstein GL, Habib M, Palm G. Dynamics of neuronal firing correlation: modulation of “effective connectivity”. J Neurophysiol 61: 900–917, 1989 - PubMed
    1. Alloway KD, Zhang M, Dick SH, Roy SA. Pervasive synchronization of local neural networks in the secondary somatosensory cortex of cats during focal cutaneous stimulation. Exp Brain Res 147: 227–242, 2002 - PubMed
    1. Bair W, Zohary E, Newsome WT. Correlated firing in macaque visual area MT: time scales and relationship to behavior. J Neurosci 21: 1676–1697, 2001 - PMC - PubMed
    1. Blake DT, Strata F, Kempter R, Merzenich MM. Experience-dependent plasticity in S1 caused by noncoincident inputs. J Neurophysiol 94: 2239–2250, 2005 - PMC - PubMed
    1. Darian-Smith I, Kenins P. Innervation density of mechanoreceptive fibres supplying glaborous skin of the monkey's index finger. J Physiol 309: 147–155, 1980 - PMC - PubMed

Publication types

LinkOut - more resources