Electrophoretic separations in poly(dimethylsiloxane) microchips using mixtures of ionic, nonionic and zwitterionic surfactants
- PMID: 23019105
- PMCID: PMC3804416
- DOI: 10.1002/elps.201200255
Electrophoretic separations in poly(dimethylsiloxane) microchips using mixtures of ionic, nonionic and zwitterionic surfactants
Abstract
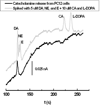
The use of surfactant mixtures to affect both EOF and separation selectivity in electrophoresis with PDMS substrates is reported, and capacitively coupled contactless conductivity detection is introduced for EOF measurement on PDMS microchips. First, the EOF was measured for two nonionic surfactants (Tween 20 and Triton X-100), mixed ionic/nonionic surfactant systems (SDS/Tween 20 and SDS/Triton X-100), and finally for the first time, mixed zwitterionic/nonionic surfactant systems (TDAPS/Tween 20 and TDAPS/Triton X-100). EOF for the nonionic surfactants decreased with increasing surfactant concentration. The addition of SDS or TDAPS to a nonionic surfactant increased EOF. After establishing the EOF behavior, the separation of model catecholamines was explored to show the impact on separations. Similar analyte resolution with greater peak heights was achieved with mixed surfactant systems containing Tween 20 and TDAPS relative to the single surfactant system. Finally, the detection of catecholamine release from PC12 cells by stimulation with 80 mM K(+) was performed to demonstrate the usefulness of mixed surfactant systems to provide resolution of biological compounds in complex samples.
© 2012 WILEY-VCH Verlag GmbH & Co. KGaA, Weinheim.
Conflict of interest statement
The authors have declared no conflict of interest.
Figures


Similar articles
-
Electrophoretic separations in poly(dimethylsiloxane) microchips using a mixture of ionic and zwitterionic surfactants.Electrophoresis. 2012 Jan;33(2):379-87. doi: 10.1002/elps.201100259. Electrophoresis. 2012. PMID: 22222982 Free PMC article.
-
Micellar partitioning and its effects on Henry's law constants of chlorinated solvents in anionic and nonionic surfactant solutions.Environ Sci Technol. 2006 Jan 1;40(1):208-14. doi: 10.1021/es051387e. Environ Sci Technol. 2006. PMID: 16433353
-
Micellar-enhanced ultrafiltration of copper ions using sodium dodecyl sulfate and its mixture with Brij 35, Tween 80 and Triton X-100.Water Sci Technol. 2013;67(10):2154-9. doi: 10.2166/wst.2013.126. Water Sci Technol. 2013. PMID: 23676382
-
Lipase Catalysis in Presence of Nonionic Surfactants.Appl Biochem Biotechnol. 2020 Jun;191(2):744-762. doi: 10.1007/s12010-019-03212-w. Epub 2019 Dec 18. Appl Biochem Biotechnol. 2020. PMID: 31853875 Review.
-
Measurement of electroosmotic flow in capillary and microchip electrophoresis.J Chromatogr A. 2007 Nov 2;1170(1-2):1-8. doi: 10.1016/j.chroma.2007.08.083. Epub 2007 Sep 12. J Chromatogr A. 2007. PMID: 17915240 Review.
Cited by
-
Isolation of target DNA using synergistic magnetic bead transport and electrokinetic flow.Biomicrofluidics. 2021 Mar 17;15(2):024104. doi: 10.1063/5.0045307. eCollection 2021 Mar. Biomicrofluidics. 2021. PMID: 33763161 Free PMC article.
-
Integrated hybrid polystyrene-polydimethylsiloxane device for monitoring cellular release with microchip electrophoresis and electrochemical detection.Anal Methods. 2015 Feb 7;7(3):884-893. doi: 10.1039/C4AY02569E. Anal Methods. 2015. PMID: 25663849 Free PMC article.
-
Micro total analysis systems: fundamental advances and biological applications.Anal Chem. 2014 Jan 7;86(1):95-118. doi: 10.1021/ac403688g. Epub 2013 Dec 13. Anal Chem. 2014. PMID: 24274655 Free PMC article. Review. No abstract available.
References
-
- Reyes DR, Iossifidis D, Auroux PA, Manz A. Analytical Chemistry. 2002;74:2623–2636. - PubMed
-
- Auroux PA, Iossifidis D, Reyes DR, Manz A. Analytical Chemistry. 2002;74:2637–2652. - PubMed
-
- Vandaveer WR, Pasas SA, Martin RS, Lunte SM. Electrophoresis. 2002;23:3667–3677. - PubMed
-
- Vickers JA, Dressen BM, Weston MC, Boonsong K, Chailapakul O, Cropek DM, Henry CS. Electrophoresis. 2007;28:1123–1129. - PubMed
-
- Vickers JA, Caulum MM, Henry CS. Analytical Chemistry. 2006;78:7446–7452. - PubMed
Publication types
MeSH terms
Substances
Grants and funding
LinkOut - more resources
Full Text Sources

