. 2012 Nov;22(11):2290-301.
doi: 10.1101/gr.139360.112. Epub 2012 Sep 27.

Integration of ChIP-seq and machine learning reveals enhancers and a predictive regulatory sequence vocabulary in melanocytes

Affiliations

Integration of ChIP-seq and machine learning reveals enhancers and a predictive regulatory sequence vocabulary in melanocytes

David U Gorkin et al. Genome Res. 2012 Nov.

Abstract

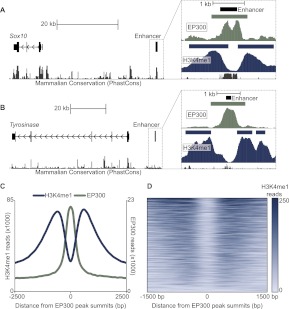
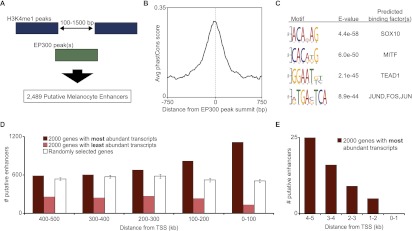
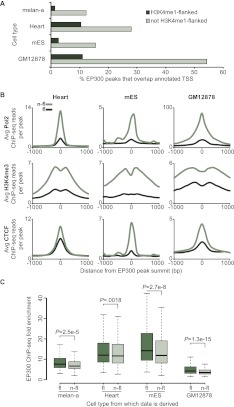
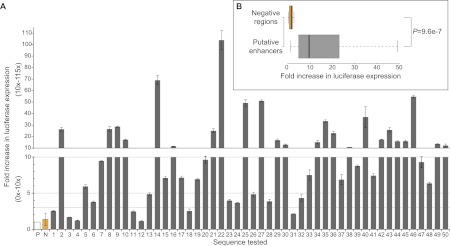
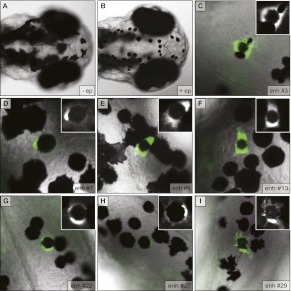
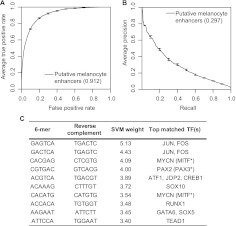
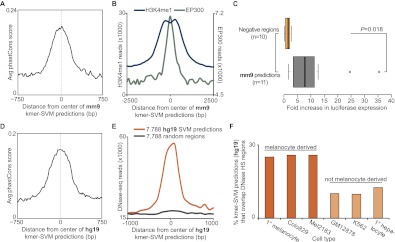
We take a comprehensive approach to the study of regulatory control of gene expression in melanocytes that proceeds from large-scale enhancer discovery facilitated by ChIP-seq; to rigorous validation in silico, in vitro, and in vivo; and finally to the use of machine learning to elucidate a regulatory vocabulary with genome-wide predictive power. We identify 2489 putative melanocyte enhancer loci in the mouse genome by ChIP-seq for EP300 and H3K4me1. We demonstrate that these putative enhancers are evolutionarily constrained, enriched for sequence motifs predicted to bind key melanocyte transcription factors, located near genes relevant to melanocyte biology, and capable of driving reporter gene expression in melanocytes in culture (86%; 43/50) and in transgenic zebrafish (70%; 7/10). Next, using the sequences of these putative enhancers as a training set for a supervised machine learning algorithm, we develop a vocabulary of 6-mers predictive of melanocyte enhancer function. Lastly, we demonstrate that this vocabulary has genome-wide predictive power in both the mouse and human genomes. This study provides deep insight into the regulation of gene expression in melanocytes and demonstrates a powerful approach to the investigation of regulatory sequences that can be applied to other cell types.


Figures

Figure 1.
Figure 1.
EP300 and H3K4me1 ChIP-seq signature at melanocyte enhancers. (A, left) Schematic of chr15:78,984,500–79,034,500 (UCSC Genome Browser; mm9) showing Sox10 and previously characterized melanocyte enhancer Sox10 MSC#5. (Right) Detailed view of the region immediately surrounding Sox10 MSC#5 (chr15:79030709–79033709), showing ChIP-seq data for EP300 (green) and H3K4me1 (blue) in melan-a. Rectangles are ChIP-seq peaks, and colored vertical bars below peaks show density of ChIP-seq reads in 10-bp bins. Gray bars at the bottom of inset show the phastCons score (Euarchontoglires). (B) Same scheme as in A, but showing the interval chr7:94,575,283–94,662,322 containing the Tyr gene and previously characterized melanocyte enhancer Tyr DRE-15kb. Interval shown to the right is chr7:94655287–94658287. (C) Number of ChIP-seq reads for H3K4me1 (blue, left axis) and EP300 (green, right axis) in a 5-kb window around the summits of 3622 EP300 peaks (averaged in 100-bp bins). (D) Heatmap showing the number of H3K4me1 ChIP-seq reads in a 3-kb window around 3,622 EP300 peaks.
Figure 2.
Figure 2.
H3K4me1-flanked EP300 peaks have multiple characteristics of melanocyte enhancers. (A) Visual representation of our approach to identify putative melanocyte enhancers (described in text and Methods). (B) Average phastCons score (vertebrate, mm9) in a 1.5-kb window around the summit of 2489 putative melanocyte enhancers. (C) Top four motifs enriched in sequences of putative enhancers, with corresponding E-values (enrichment P-value times number of motifs tested; calculated by DREME) and factors predicted to bind to these motifs. (D) Number of putative enhancers in 1-MB window (100-kb bins) around the TSS of 2000 genes with the most abundant transcripts in melan-a (dark red), 2000 genes with least abundant transcripts in melan-a (light red), and 2000 randomly selected genes (white; average of five sets with SD represented by error bars). (E) Similar analysis to D, but using a 10-kb window and 1-kb bins.
Figure 3.
Figure 3.
EP300 peaks that overlap H3K4me1-flanked regions have distinct properties. (A) Percent of EP300 peaks that directly overlap an annotated TSS (UCSC Genes; [dark green] peaks that overlap H3K4me1-flanked regions; [light green] peaks that do not overlap H3K4me1-flanked regions). Data for Heart (C57bl/6 mouse tissue taken at 8 wk), mES (Mouse ES-Bruce 4), and GM12878 generated by ENCODE and modENCODE consortia. (B) Average number ChIP-seq reads per peak for Pol2 (top row), H3K4me3 (middle row), and CTCF (bottom row) in a 2-kb window around the summits of indicated EP300 peaks (H3K4me1-flanked indicated by fl and dark green; non-H3K4me1-flanked, n-fl and light green). Three columns show data from the heart, mES, and GM12878, respectively. (C) EP300 ChIP-seq fold enrichment (determined by MACS) of EP300 peaks that overlap H3K4me1-flanked regions (fl; darker green), and EP300 peaks that do not overlap H3K4me1-flanked regions (n-fl; lighter green). Corresponding P-values calculated by two-tailed t-test. Numbers of peaks are as follows: melan-a fl, 2489; n-fl, 1133; heart fl, 3324; heart n-fl, 23,236; mES fl, 1258; mES n-fl, 20,062; GM12878 fl, 3404; and GM12878 n-fl, 6703.
Figure 4.
Figure 4.
Putative melanocyte enhancers direct reporter expression in melan-a. (A) Fold increase in luciferase reporter expression directed by indicated sequence relative to promoter-only control (P; white bar). Gray bars show fold increase of randomly selected putative enhancers (numbered 1–50). N (orange bar) represents the average of 10 negative regions. (Error bars) SD of three biological replicates, except in the case of N, where error bars show the standard deviation of 10 different negative regions. Note the difference in scale between bottom panel (onefold to 10-fold by one) and top panel (10-fold to 115-fold by 10). (Dotted lines) 10-fold, fivefold, and threefold thresholds (top to bottom). (B) Box plot summarizing results of reporter assays for 10 negative regions (top, orange) and 50 putative enhancers (bottom, gray). P = 9.564 × 10⁻⁷ by two-tailed t-test. Four outliers in putative enhancer group not shown in box plot (nos. 14, 22, 27, 46).
Figure 5.
Figure 5.
Putative enhancers direct reporter expression in melanocytes of transgenic zebrafish embryos. (A) Dorsal view of melanocytes on the head of wild-type zebrafish embryo at 3 d post-fertilization (dpf). (B) Same view as A after treatment with epinephrine, which causes contraction of pigment granules to the center of the cell and enables the visualization of GFP at the periphery of melanocytes in transgenic embryos. (CI) Representative images for all seven enhancers positive in this assay showing GFP-positive melanocytes in transgenic (mosaic) embryos at 3 dpf after treatment with epinephrine. Numbering is consistent with Figure 4.
Figure 6.
Figure 6.
Analysis of kmer-SVM classifier trained with putative melanocyte enhancers. (A) Receiver operating characteristic curve for kmer-SVM classifier trained on putative melanocyte enhancers, with overall area under curve (auROC = 0.912) (B) Precision-recall curve with area under curve (auPRC = 0.297). (C) 6-mers with highest positive predictive value to kmer-SVM classifier, and factors predicted to bind each 6-mer. (*) No PWM in queried databases. Match based on similarity to published binding specificities (see Methods).
Figure 7.
Figure 7.
kmer-SVM classifier predicts additional enhancers in the mouse and human genomes. (AC) Mouse predictions; (DF) human. (A) Average phastCons score (vertebrate, mm9) in a 1.5-kb window around the centers of the 7361 kmer-SVM-predicted mouse melanocyte enhancers. (B) Number of ChIP-seq reads for H3K4me1 (blue line, left axis) and EP300 (green, right axis) in a 5-kb window around the centers of 7361 predicted melanocyte enhancers (averaged in 100-bp bins). (C) Box plot summarizing results of reporter assays for 10 negative regions (top, orange) and 11 predicted enhancers (bottom, gray). P = 0.01803 by two-tailed t-test. (D) Average phastCons score (vertebrate, hg19) in a 1.5-kb window around the centers of the 7788 kmer-SVM–predicted human melanocyte enhancers. (E) Number of DNase-seq reads from human primary melanocytes in a 2-kb window (averaged in 100-bp bins) around the centers of predicted enhancers (orange) and randomly selected regions matched in size and GC content (gray). (F) Percentage of predicted human melanocyte enhancers (n = 7788) that overlap DNase HS peaks in six cell types, which are either derived from melanocytes (orange) or not (beige).

References

    1. Antonellis A, Bennett WR, Menheniott TR, Prasad AB, Lee-Lin SQ, Green ED, Paisley D, Kelsh RN, Pavan WJ, Ward A 2006. Deletion of long-range sequences at Sox10 compromises developmental expression in a mouse model of Waardenburg-Shah (WS4) syndrome. Hum Mol Genet 15: 259–271 - PubMed
    1. Antonellis A, Huynh JL, Lee-Lin SQ, Vinton RM, Renaud G, Loftus SK, Elliot G, Wolfsberg TG, Green ED, McCallion AS, et al. 2008. Identification of neural crest and glial enhancers at the mouse Sox10 locus through transgenesis in zebrafish. PLoS Genet 4: e1000174 doi: 10.1371/journal.pgen.1000174 - PMC - PubMed
    1. Bailey TL 2011. DREME: Motif discovery in transcription factor ChIP-seq data. Bioinformatics 27: 1653–1659 - PMC - PubMed
    1. Bailey TL, Boden M, Buske FA, Frith M, Grant CE, Clementi L, Ren J, Li WW, Noble WS 2009. MEME SUITE: Tools for motif discovery and searching. Nucleic Acids Res 37: W202–W208 - PMC - PubMed
    1. Barski A, Cuddapah S, Cui K, Roh TY, Schones DE, Wang Z, Wei G, Chepelev I, Zhao K 2007. High-resolution profiling of histone methylations in the human genome. Cell 129: 823–837 - PubMed

Publication types