

High-resolution whole-genome analysis of skull base chordomas implicates FHIT loss in chordoma pathogenesis
- PMID: 23019410
- PMCID: PMC3459274
- DOI: 10.1593/neo.12526
High-resolution whole-genome analysis of skull base chordomas implicates FHIT loss in chordoma pathogenesis
Abstract
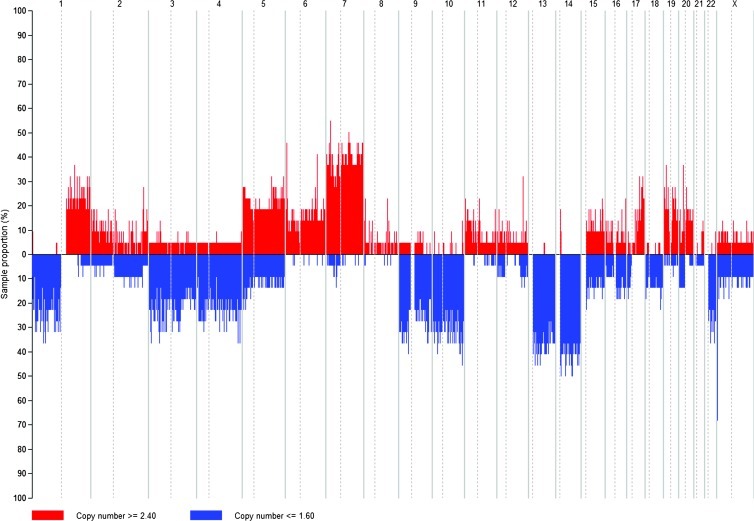
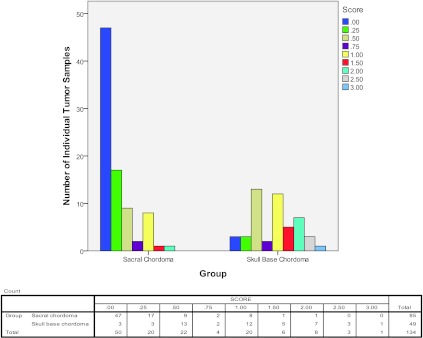
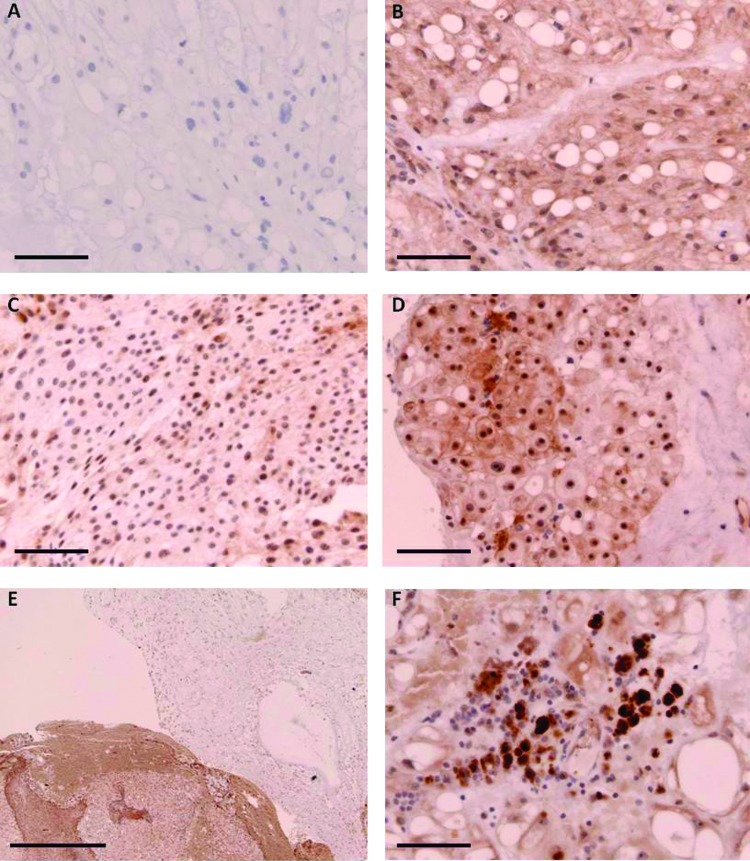
Chordoma is a rare tumor arising in the sacrum, clivus, or vertebrae. It is often not completely resectable and shows a high incidence of recurrence and progression with shortened patient survival and impaired quality of life. Chemotherapeutic options are limited to investigational therapies at present. Therefore, adjuvant therapy for control of tumor recurrence and progression is of great interest, especially in skull base lesions where complete tumor resection is often not possible because of the proximity of cranial nerves. To understand the extent of genetic instability and associated chromosomal and gene losses or gains in skull base chordoma, we undertook whole-genome single-nucleotide polymorphism microarray analysis of flash frozen surgical chordoma specimens, 21 from the clivus and 1 from C1 to C2 vertebrae. We confirm the presence of a deletion at 9p involving CDKN2A, CDKN2B, and MTAP but at a much lower rate (22%) than previously reported for sacral chordoma. At a similar frequency (21%), we found aneuploidy of chromosome 3. Tissue microarray immunohistochemistry demonstrated absent or reduced fragile histidine triad (FHIT) protein expression in 98% of sacral chordomas and 67%of skull base chordomas. Our data suggest that chromosome 3 aneuploidy and epigenetic regulation of FHIT contribute to loss of the FHIT tumor suppressor in chordoma. The finding that FHIT is lost in a majority of chordomas provides new insight into chordoma pathogenesis and points to a potential new therapeutic target for this challenging neoplasm.
Figures
References
-
- McMaster ML, Goldstein AM, Bromley CM, Ishibe N, Parry DM. Chordoma: incidence and survival patterns in the United States, 1973–1995. Cancer Causes Control. 2001;12:1–11. - PubMed
-
- Dorfman HD, Czerniak B. Bone cancers. Cancer. 1995;75:203–210. - PubMed
-
- Eriksson B, Gunterberg B, Kindblom LG. Chordoma. A clinicopathologic and prognostic study of a Swedish national series. Acta Orthop Scand. 1981;52:49–58. - PubMed
-
- Higinbotham NL, Phillips RF, Farr HW, Hustu HO. Chordoma. Thirty-five-year study at Memorial Hospital. Cancer. 1967;20:1841–1850. - PubMed
-
- Catton C, O'Sullivan B, Bell R, Laperriere N, Cummings B, Fornasier V, Wunder J. Chordoma: long-termfollow-up after radical photon irradiation. Radiother Oncol. 1996;41:67–72. - PubMed
Publication types
MeSH terms
Substances
Grants and funding
LinkOut - more resources
Full Text Sources
Miscellaneous