. 2013 Jan;25(1):157-85.
doi: 10.1162/NECO_a_00388. Epub 2012 Sep 28.

A model of the differential representation of signal novelty in the local field potentials and spiking activity of the ventrolateral prefrontal cortex

Affiliations

A model of the differential representation of signal novelty in the local field potentials and spiking activity of the ventrolateral prefrontal cortex

Jung Hoon Lee et al. Neural Comput. 2013 Jan.

Abstract

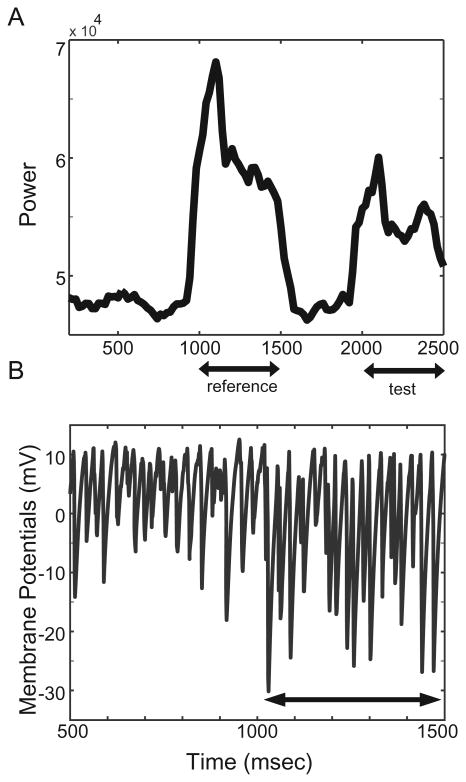
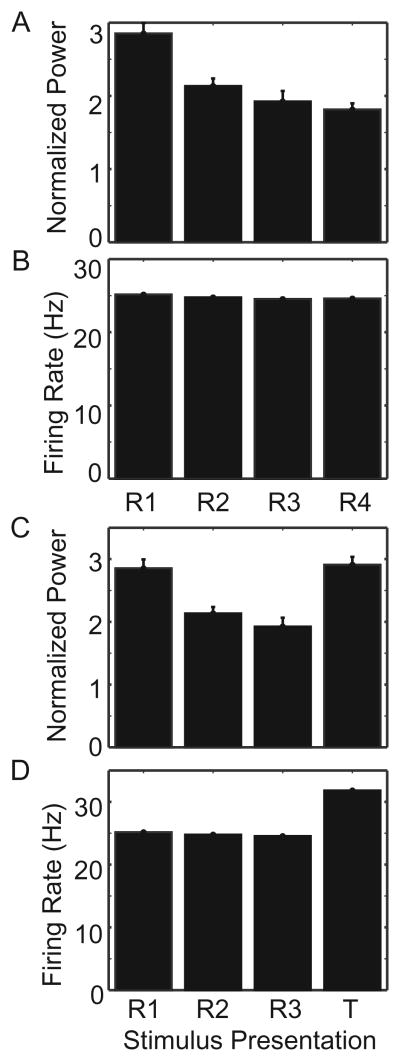
Local field potentials (LFPs) and spiking activity reflect different types of information procssing. For example, neurophysiological studies indicate that signal novelty in the ventrolateral prefrontal cortex is differentially represented by LFPs and spiking activity: LFPs habituate to repeated stimulus presentations, whereas spiking activity does not. The neural mechanisms that allow for this differential representation between LFPs and spiking activity are not clear. Here, we model and simulate LFPs and spiking activity of neurons in the ventrolateral prefrontal cortex in order to elucidate potential mechanisms underlying this differential representation. We demonstrate that dynamic negative-feedback loops cause LFPs to habituate in response to repeated presentations of the same stimulus while spiking activity is maintained. This disassociation between LFPs and spiking activity may be a mechanism by which LFPs code stimulus novelty, whereas spiking activity carries abstract information, such as category membership and decision-related activity.


Figures

Figure 1
Figure 1
Schematic of the model. (A) Each circle represents a population of neurons. The neural populations of the STG are shown on the left of the model in the area enclosed by the dashed line box. E1 and E2 are type 1 and type 2 STG excitatory (E) neural populations, respectively. IS, IS, and ID are STG inhibitory (I) populations, respectively. The vPFC has two populations of neurons: a population of E neurons (EV) and a population of I neurons (IV). (See Table 2 for synaptic connection strengths.) (B) During a simulation, vPFC neurons were stimulated by noisy stimulus-independent input, simulated with Poisson spike trains at the rate of PυPFC, and stimulus-dependent afferent inputs from the STG. In contrast, STG neurons were stimulated by presentations of a simulated auditory stimulus with Poisson spike trains at the rate of PSTG. In this panel, only two stimulus presentations are shown. These stimulus presentations are separated by a delay period of 500 msec. The 500 msec period prior to stimulus presentation was defined as the baseline period for the LFPs.
Figure 2
Figure 2
Baseline AMP in the vPFC. (A) The power spectrum of baseline AMP as a function of recurrent synaptic strength (JEV) and the probability of receiving a synaptic input from a particular neuron (PC) in the vPFC. (B) The neurophysiological and simulated baseline AMP power spectrum in black and gray, respectively. (C) AMP power was modulated as a function of the reduction of external in puts to the vPFC/neurons. For each of the tested set of parameters, 50 simulations were performed, and the power spectrum was calculated for each simulation. The data in the figure are the average of these 50 power spectra.
Figure 3
Figure 3
Responses of the STG and vPFC neurons as a function of STG structure. (A) The reduced model; see text for details. (B) The synchrony (κ) of STG neural activity is shown as a function of synaptic weight (JS). (C) The normalized AMP power was dependent on the difference between J1 and J2 and the synaptic weight JS. The mean values of standard errors of synchrony index were calculated from 100 pairs of spiking trains in the STG. In panel C, each data point is the average of 50 simulations, and the error bars indicate 1 standard error.
Figure 4
Figure 4
vPFC activity in response to the inputs from type 2 STG E neurons (JE2VJE2EV = JE2IV). Both the AMP power spectra (A) and the firing rates (B) are shown as a function of JE2EV. The data show the average value of 50 simulations. The error bars indicate 1 standard deviation.
Figure 5
Figure 5
Time course of band-limited power of AMP between 4 Hz and 50 Hz (A) and the average membrane potential of 100 vPFC neurons during the reference stimulus period (B).
Figure 6
Figure 6
vPFC LFPs (AMP) and firing rates as a function of stimulus presentation (repeat number). (A) AMP power habituated (t-test, P < 0.01), whereas (B) the firing rates did not habituate with repeated-stimulus presentations (t-test, P > 0.1). AMP power and firing rates were calculated from 100 simulations. Each bar graph represents the mean value, and the error bars indicate 1 standard deviation. For comparison, panels C and D show corresponding neurophysiological data collected during the first and the second presentation of a monkey vocalization (Baker et al., 2009). (E, F) The power spectrum of simulated and neurophysiological LFPs, respectively, as a function of stimulus presentation.
Figure 7
Figure 7
Habituation of AMP and ASS. (A, B) Normalized power of AMP and neurophysiological LFPs, respectively. (C, D) Power spectra and normalized power of ASS, respectively.
Figure 8
Figure 8
Neural responses simulated using the conductance-based (α) model. (A) Time course of ASS between 4 Hz and 50 Hz and (B) power spectrum of ASS. The B arrows in panel A indicate the stimulus periods. (C, D) The effects of stimulus presentation (i.e., repeat number) on vPFC LFPs and the firing rate, respectively. The data show the average value of 100 simulations. The error bars indicate 1 standard deviation. (E) The relationship between normalized ASS power, repeat number, and the form of the linear combination of IA and IG. See the figure key for the exact form of the linear combination.
Figure 9
Figure 9
Neural response to multiple repetitions (i.e., repeat number) of the reference stimulus. (A) The z-scored AMP power in the simulated vPFC in response to four presentations of the reference stimulus (R1, R2, R3, and R4) and (B) spiking activity. (C, D) The effect that three presentations of the reference stimulus (R1, R2, and R3) and the novel test stimulus (T) had on AMP power and spiking activity are displayed, respectively. In these panels, the same reference stimulus was presented repeatedly three times and was then followed by a novel test stimulus presentation. The data show the average value of 100 simulations. The error bars indicate 1 standard error.
Figure 10
Figure 10
The effect of noisy afferent inputs to the STG. (A) AMP power as a function of repeated-stimulus presentations (i.e., repeat number) and noise input. The scale of the y-axis is relative power. The gray scale indicates the different levels of noise added to the type 1 STG E neurons. (B) The effect that noisy afferent input had on vPFC firing rate.

Similar articles

Cited by

References

    1. Anderson L, Christianson G, Linden J. Stimulus-specific adaptation occurs in the auditory thalamus. J Neurosci. 2009;29:7359–7363. - PMC - PubMed
    1. Baker A, Tsunada J, Davis S, Cohen Y, Ghazanfar A. Context-dependent neural representation of vocalizations in primate ventrolateral prefrontal cortex. 2009:578–8/GG13. SFN.
    1. Baldeweg T. Repetition effects to sounds: Evidence for predictive coding in the auditory system. Trends Cog Sci. 2006;10:93–94. - PubMed
    1. Bazhenov M, Stopfer M, Rabinovich M, Huerta R, Abarbanel H, Sejnowski T, et al. Model of transient oscillatory synchronization in the locust antennal lobe. Neuron. 2001;30:553–567. - PMC - PubMed
    1. Brunel N. Dynamics of sparsely connected networks of excitatory and inhibitory spiking neurons. J Comput Neurosci. 2000;8:183–208. - PubMed

Publication types

MeSH terms

LinkOut - more resources