. 2012 Sep 28:9:227.
doi: 10.1186/1742-2094-9-227.

Interferon regulatory factor 8/interferon consensus sequence binding protein is a critical transcription factor for the physiological phenotype of microglia

Affiliations

Interferon regulatory factor 8/interferon consensus sequence binding protein is a critical transcription factor for the physiological phenotype of microglia

Makoto Horiuchi et al. J Neuroinflammation. .

Abstract

Background: Recent fate-mapping studies establish that microglia, the resident mononuclear phagocytes of the CNS, are distinct in origin from the bone marrow-derived myeloid lineage. Interferon regulatory factor 8 (IRF8, also known as interferon consensus sequence binding protein) plays essential roles in development and function of the bone marrow-derived myeloid lineage. However, little is known about its roles in microglia.

Methods: The CNS tissues of IRF8-deficient mice were immunohistochemically analyzed. Pure microglia isolated from wild-type and IRF8-deficient mice were studied in vitro by proliferation, immunocytochemical and phagocytosis assays. Microglial response in vivo was compared between wild-type and IRF8-deficient mice in the cuprizon-induced demyelination model.

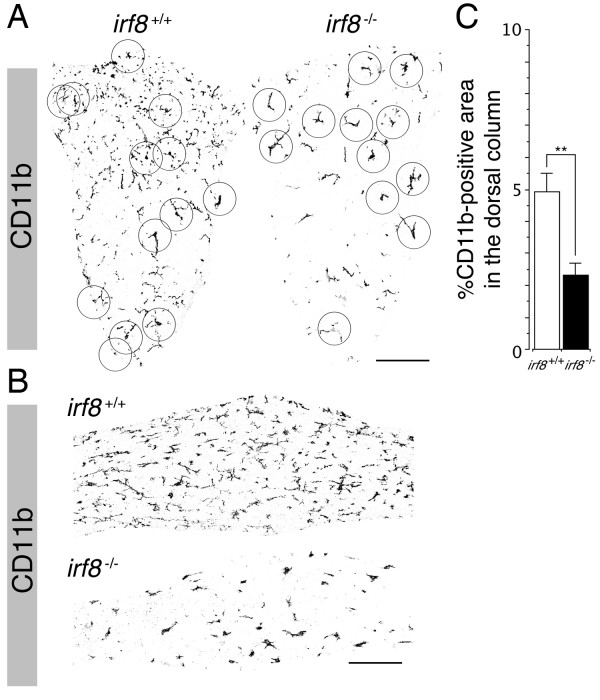
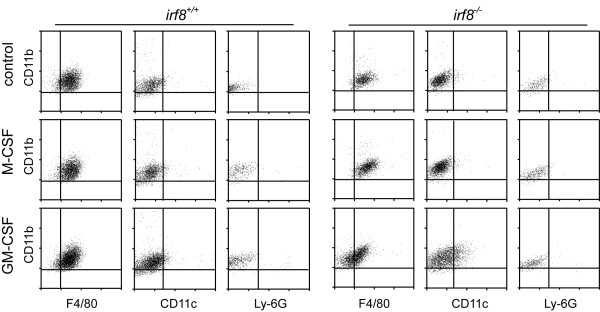
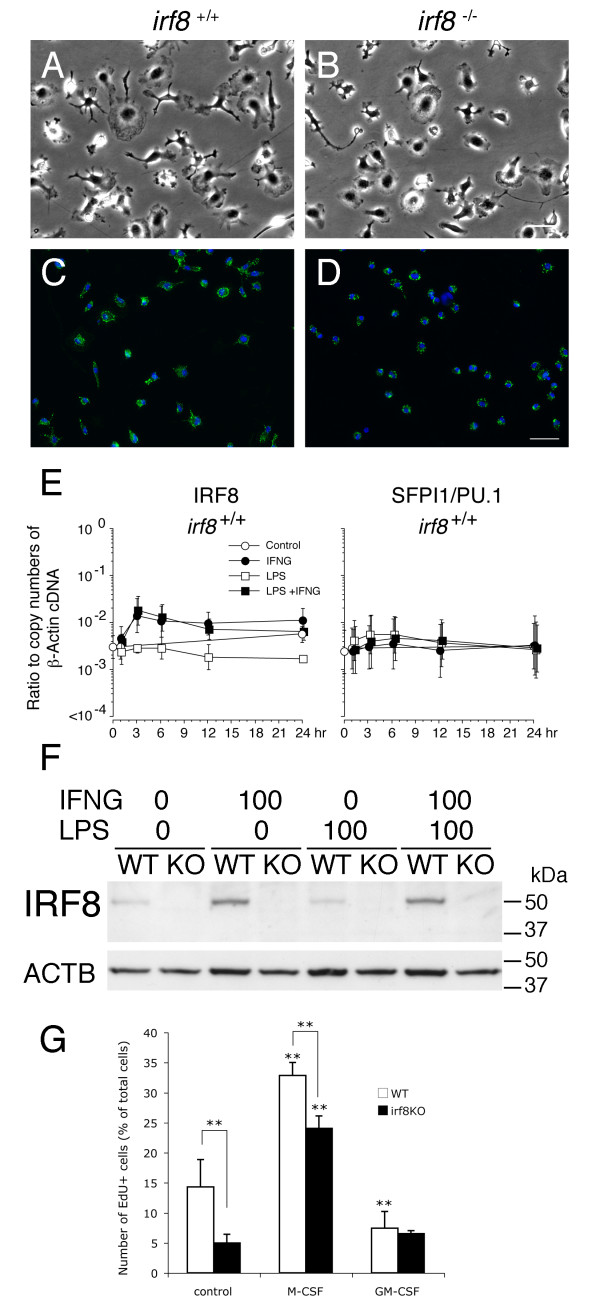
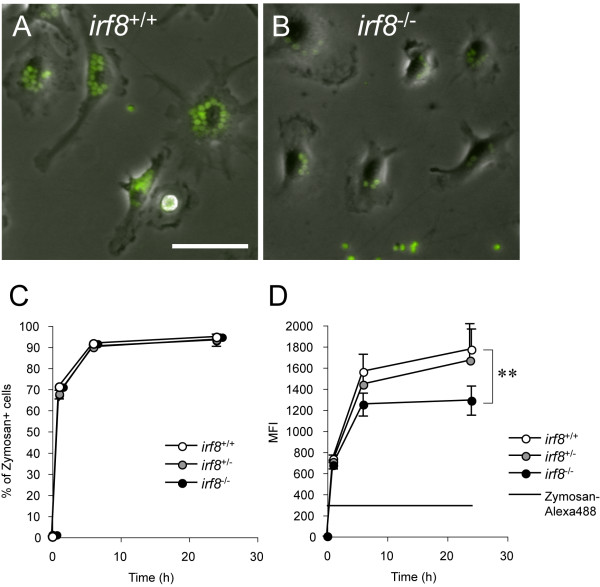
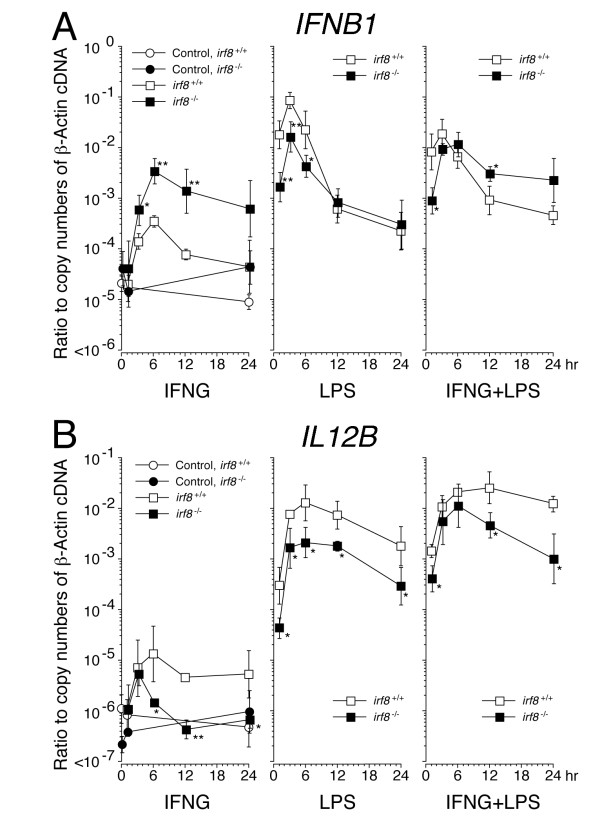
Results: Our analysis of IRF8-deficient mice revealed that, in contrast to compromised development of IRF8-deficient bone marrow myeloid lineage cells, development and colonization of microglia are not obviously affected by loss of IRF8. However, IRF8-deficient microglia demonstrate several defective phenotypes. In vivo, IRF8-deficient microglia have fewer elaborated processes with reduced expression of IBA1/AIF1 compared with wild-type microglia, suggesting a defective phenotype. IRF8-deficient microglia are significantly less proliferative in mixed glial cultures than wild-type microglia. Unlike IRF8-deficient bone marrow myeloid progenitors, exogenous macrophage colony stimulating factor (colony stimulating factor 1) (M-CSF (CSF1)) restores their proliferation in mixed glial cultures. In addition, IRF8-deficient microglia exhibit an exaggerated growth response to exogenous granulocyte-macrophage colony stimulating factor (colony stimulating factor 2) (GM-CSF (CSF2)) in the presence of other glial cells. IRF8-deficient microglia also demonstrate altered cytokine expressions in response to interferon-gamma and lipopolysaccharide in vitro. Moreover, the maximum phagocytic capacity of IRF8-deficient microglia is reduced, although their engulfment of zymosan particles is not overtly impaired. Defective scavenging activity of IRF8-deficient microglia was further confirmed in vivo in the cuprizone-induced demyelination model in mice.

Conclusions: This study is the first to demonstrate the essential contribution of IRF8-mediated transcription to a broad range of microglial phenotype. Microglia are distinct from the bone marrow myeloid lineage with respect to their dependence on IRF8-mediated transcription.


Figures

Figure 1
Figure 1
IRF8-deficient microglia colonized the CNS normally, but could not be identified by AIF1/IBA1 immunoreactivity. The spinal cords obtained from adult Irf8+/+ and Irf8-/- mice were immunolabeled for various microglial markers (A), and positive cells in the dorsal column at the Th1 spinal level were quantified (B). Microglia were reliably identified as CD11b and PU.1 double positive cells in both Irf8+/+ and Irf8-/- CNS tissues (pink arrows in far left panels in A). Note that few Irf8-/- microglia demonstrated detectable immunoreactivity for AIF1/IBA1. Scale bar: 100 μm. **P < 0.01. (C) 20 μm-thick z-stack confocal images of the microglia immunolabeled for CD11b (green) and PU.1 (red) in the dorsal columns at the Th1 spinal level. CD11b-positive microglial processes were much sparser in the dorsal column of Irf8-/- mice than those in Irf8+/+ mice, and processes of Irf8-/- microglia were thicker and less elaborated than those of Irf8+/+ microglia. PU.1-positive microglial nuclei are indicated by arrows, demonstrating that similar numbers of microglia are distributed in the Irf8+/+ and Irf8-/- spinal cords in contrast to the different density of the microglial processes. Scale bar: 100 μm.
Figure 2
Figure 2
Irf8-/- CNS tissues contain significantly less microglial processes than Irf8+/+ tissues. (A) Dorsal columns at the Th1 spinal level were immunolabeled for CD11b and PU.1, and inverted confocal fluorescence images of 12 μm-thick transverse sections are shown in monochrome. Only cross-sectional areas of the dorsal columns are shown. The location of each microglial nucleus positive for PU.1 is indicated by a circle to demonstrate similar distributions of microglia between the Irf8+/+ and Irf8-/- dorsal columns, which contrasts to lower densities of CD11b-positive microglial processes in Irf8-/- mice than in Irf8+/+ mice. (B) Similar difference was observed in the coronal sections of the corpus callosum. (C) The percentages of CD11b-positive areas in the whole cross-sectional area of the dorsal column were measured and compared quantitatively between Irf8-/- (closed bar) and Irf8+/+ mice (open bar). Three 3-month-old animals were used in each genotype. **P < 0.01. Scale bar: 100 μm.
Figure 3
Figure 3
IRF8-deficient microglia in the mixed glial cultures exhibited a hyperproliferative phenotype in response to M-CSF and GM-CSF. A-I, Phase contrast images of mixed glial cultures from Irf8+/+ (A-C), Irf8+/- (D-F), and Irf8-/- (G-I) brain tissues. Cells were transferred to medium alone (control), medium supplemented with M-CSF (20 ng/ml) or GM-CSF (20 ng/ml) at 5 days in vitro, and then maintained in the same medium for another 4 days. Most microglia were seen as phase-bright round cells on the sheet of flat glial cells. Scale Bar: 50 μm. (J-K) Percentages of EdU-positive cells in total CD11b+ (J) or CD11b- (K) cells in the mixed glial cultures of the respective genotypes. Cells treated medium alone (cont), or medium supplemented with M-CSF (20 ng/ml) or GM-CSF (20 ng/ml) for 4 days were exposed to EdU at 6 hours prior to fixation, and double-stained for CD11b and EdU. **P < 0.01 and N.S indicates no significant difference in a comparison of the two groups indicated.
Figure 4
Figure 4
F4/80, CD11c, and Ly-6G expression in Irf8+/+ and Irf8-/- microglia in the mixed glial cultures maintained in the presence of M-CSF or GM-CSF. Mixed glial cells were cultured in medium alone (control) or medium supplemented with M-CSF (20 ng/ml) or GM-CSF (20 ng/ml) for 4 days, and labeled with anti-CD45 and anti-CD11b antibodies in combination with each of anti-F4/80, anti-CD11c or anti-Ly-6G antibodies. The bivariate plots show expression of CD11b, F4/80, CD11c and Ly-6G on gated CD45-positive cells. The quadrants were set using corresponding isotype controls.
Figure 5
Figure 5
Purified Irf8+/+ and Irf8-/- microglia in vitro. (A-D) Representative phase contrast (A, B) and immunocytochemical (C, D) pictures of the microglia isolated from the Irf8+/+ (A, C) and Irf8-/- (B, D) mixed glial cultures grown in the presence of M-CSF (20 ng/ml) by magnetic-activated cell sorting. Purified cells were immunolabeled for CD11b (green in C, D) at 24 h after isolation. Nuclei were counterstained with DAPI (blue). Scale Bar: 50 μm. (E)IRF8 and PU.1/SFPI1 mRNA levels in the purified Irf8+/+ microglia. Purified microglia were incubated in medium alone (control) or in the presence of IFNγ (IFNG, 100 ng/ml), lipopolysaccharide (LPS, 100 ng/ml) or both for 24 h. Reverse transcribed IRF8 and PU.1/SFPI1 cDNA levels are plotted as ratios to copy numbers of β-actin cDNA on a logarithmic scale. (F) Immunoblots for IRF8 confirmed the results of mRNA. (G) Purified Irf8-/- CD11b+ microglia were less proliferative than Irf8+/+ CD11b+ microglia even in the presence of exogenous M-CSF. Purified microglia were preincubated with medium alone for 24 h after isolation from Irf8+/+ (open bars) and Irf8-/- (closed bars) mixed glial cultures, and then treated with medium alone (control), or medium supplemented with M-CSF (20 ng/ml) or GM-CSF (20 ng/ml) for 24 h. After a 6 hour incubation with EdU, EdU-positive and DAPI-positive nuclei were counted. **P < 0.01 in comparison with control or between the two groups indicated.
Figure 6
Figure 6
IRF8-deficient microglia demonstrated a reduced phagocytic capacity in vitro. Microglia from Irf8+/+ (A) and Irf8-/- (B) mice were incubated with Alexa Fluor™ 488-conjugated zymosan particles for 24 hours. Scale bar: 50 μm. (C-D) Percentages of Alexa Fluor™ 488-positive cells in total cells (C) and mean fluorescent intensity (MFI) of Alexa Fluor™ 488-positive cells (D) were measured in Irf8+/+, Irf8+/-, and Irf8-/- microglial cultures at 0, 1, 6, and 24 hour after adding the zymosan particles. The MFI of a non-phagocytosed Alexa Fluor™ 488-conjugated zymosan particle is also shown (Zymosan- Alexa488) in D. **P < 0.001 in comparison with the two groups indicated.
Figure 7
Figure 7
AIF1/IBA1 expression in Irf8-/- microglia was reduced but still inducible by IFNγ. (A) Quantitative and kinetic analysis of AIF1/IBA1 mRNA in Irf8+/+ and Irf8-/- microglia after addition of medium alone (Control, open circle), IFNγ (IFNG, 100 ng/ml, closed circle), lipopolysaccharide (LPS, 100 ng/ml, open square) or both (closed square). Reverse transcribed cDNA levels at the indicated time points were quantified by qPCR and are plotted as ratios to copy numbers of β-actin cDNA on a logarithmic scale. Data were from at least three independent experiments. At time 0, data from controls are only shown. (B) Irf8-/- microglia expressed far less AIF1/IBA1 protein than Irf8+/+ microglia. Purified microglia were maintained in the medium containing IFNγ (IFNG, 100 ng/ml), lipopolysaccharide (LPS, 100 ng/ml) or both for 24 h. Subsequent immunoblots for β-actin (ACTB) are shown for equal protein loading.
Figure 8
Figure 8
Kinetics of IFNB1 (A) and IL12B (B) mRNA levels in Irf8+/+ and Irf8-/- microglia after the exposure to IFNγ and lipopolysaccharide. Purified microglia were incubated in medium alone (Control, closed and open circle in the left panels) or in the presence of IFNγ (IFNG, 100 ng/ml), lipopolysaccharide (LPS, 100 ng/ml) or both (IFNG + LPS) for 24 h. IFNB1 and IL12B mRNA at the indicated time points were quantified by qPCR and are plotted as ratios to copy numbers of β-actin cDNA on a logarithmic scale. Data were calculated from at least three independent experiments in each genotype. At time 0, data from controls are only shown. **P < 0.01 and *P < 0.05, in a comparison of the two genotypes at the indicated time points.
Figure 9
Figure 9
A defective phenotype of IRF8-deficient microglia in vivo in the cuprizone-induced demyelination model. (A) There was no quantitative difference in corpus callosal microglia, myelinating oligodendrocytes, and NG2-positive oligodendroglial precursor cells between Irf8+/+ and Irf8-/- mice before cuprizone feeding. Microglia and myelinating oligodendrocytes were identified by immunoreactivity for nuclear PU.1 and for the cytosolic CC1 epitope, respectively. (B) Cuprizone-mediated demyelination in the medial corpus callosum in Irf8+/+ and Irf8-/- mice. Representative LFB-PAS-stained paraffin sections of the medial corpus callosi of Irf8+/+ and Irf8-/- mice at 4 and 6 weeks of cuprizone diet (left panel). Scale bar: 100 μm. Reduction of myelinating oligodendrocytes in the corpus callosum. CC1+ oligodendrocytes per unit area of 6 μm-thick coronal sections were counted. At least three mice were used for each data point (right graph). (C) Microglial accumulation in the corpus callosum was delayed in Irf8-/- mice compared with Irf8+/+ mice. CD11b+ microglia with PU.1+ nuclei were quantified in 6 μm-thick coronal sections as in B (right graph). Note that the abnormal oval cell shape of activated Irf8-/- microglia at 6 weeks of cuprizone feeding. Scale bar: 100 μm. (D) Oil red O plus hematoxylin staining of the corpus callosum of Irf8+/+ and Irf8-/- mice at 0, 4 and 6 weeks of cuprizone feeding. Lipid-rich myelin debris visualized by Oil red O staining (red arrows) rapidly accumulated in the corpus callosum of Irf8-/- mice, as demyelination progressed. Scale bar: 25 μm. Data are presented as mean ± standard error. *P < 0.05 by Mann-Whitney U test.

References

    1. Kettenmann H, Hanisch UK, Noda M, Verkhratsky A. Physiology of microglia. Physiol Rev. 2011;91:461–553. doi: 10.1152/physrev.00011.2010. - DOI - PubMed
    1. Prinz M, Mildner A. Microglia in the CNS: immigrants from another world. Glia. 2011;59:177–187. doi: 10.1002/glia.21104. - DOI - PubMed
    1. Ransohoff RM, Cardona AE. The myeloid cells of the central nervous system parenchyma. Nature. 2010;468:253–262. doi: 10.1038/nature09615. - DOI - PubMed
    1. Ajami B, Bennett JL, Krieger C, Tetzlaff W, Rossi FM. Local self-renewal can sustain CNS microglia maintenance and function throughout adult life. Nat Neurosci. 2007;10:1538–1543. doi: 10.1038/nn2014. - DOI - PubMed
    1. Mildner A, Schmidt H, Nitsche M, Merkler D, Hanisch UK, Mack M, Heikenwalder M, Brück W, Priller J, Prinz M. Microglia in the adult brain arise from Ly-6ChiCCR2+ monocytes only under defined host conditions. Nat Neurosci. 2007;10:1544–1553. doi: 10.1038/nn2015. - DOI - PubMed

Publication types

MeSH terms