. 2013 Jan;26(1):67-77.
doi: 10.1111/pcmr.12029. Epub 2012 Nov 21.

TBX2 expression is regulated by PAX3 in the melanocyte lineage

Affiliations

TBX2 expression is regulated by PAX3 in the melanocyte lineage

Fang Liu et al. Pigment Cell Melanoma Res. 2013 Jan.

Abstract

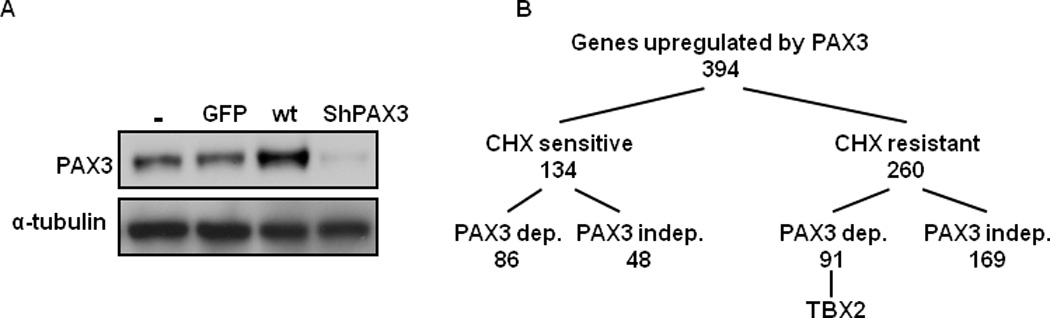
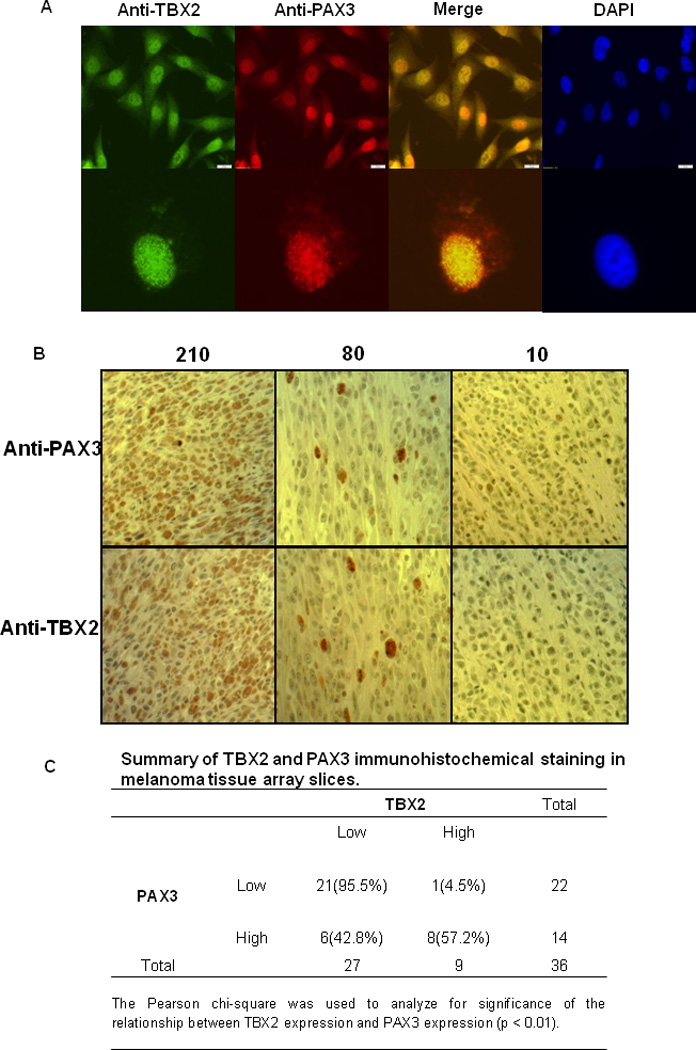
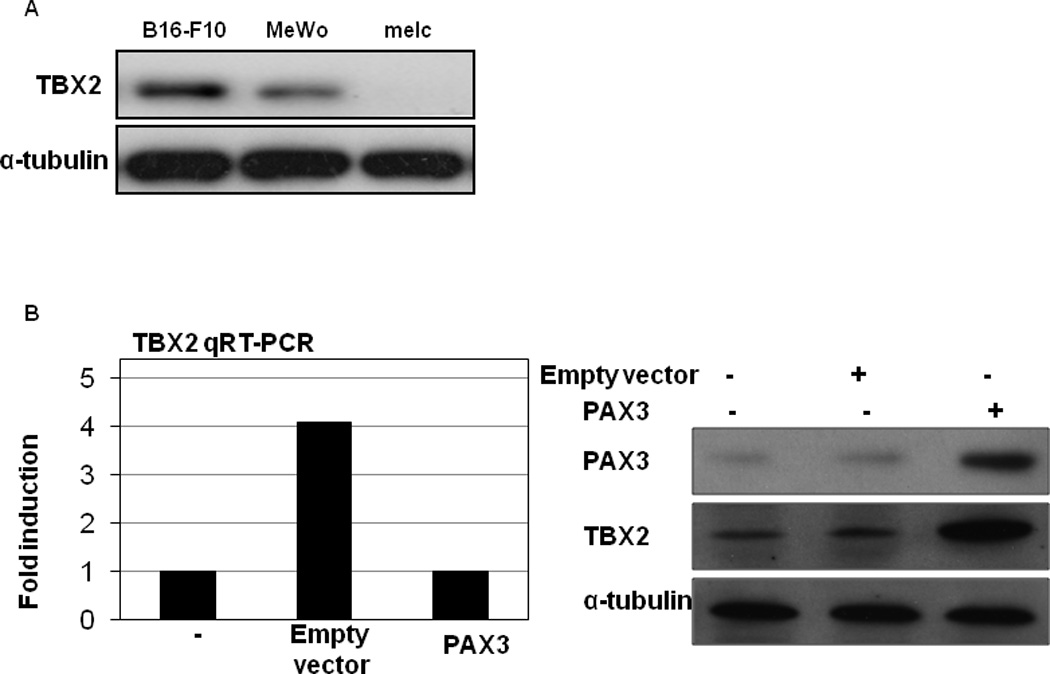
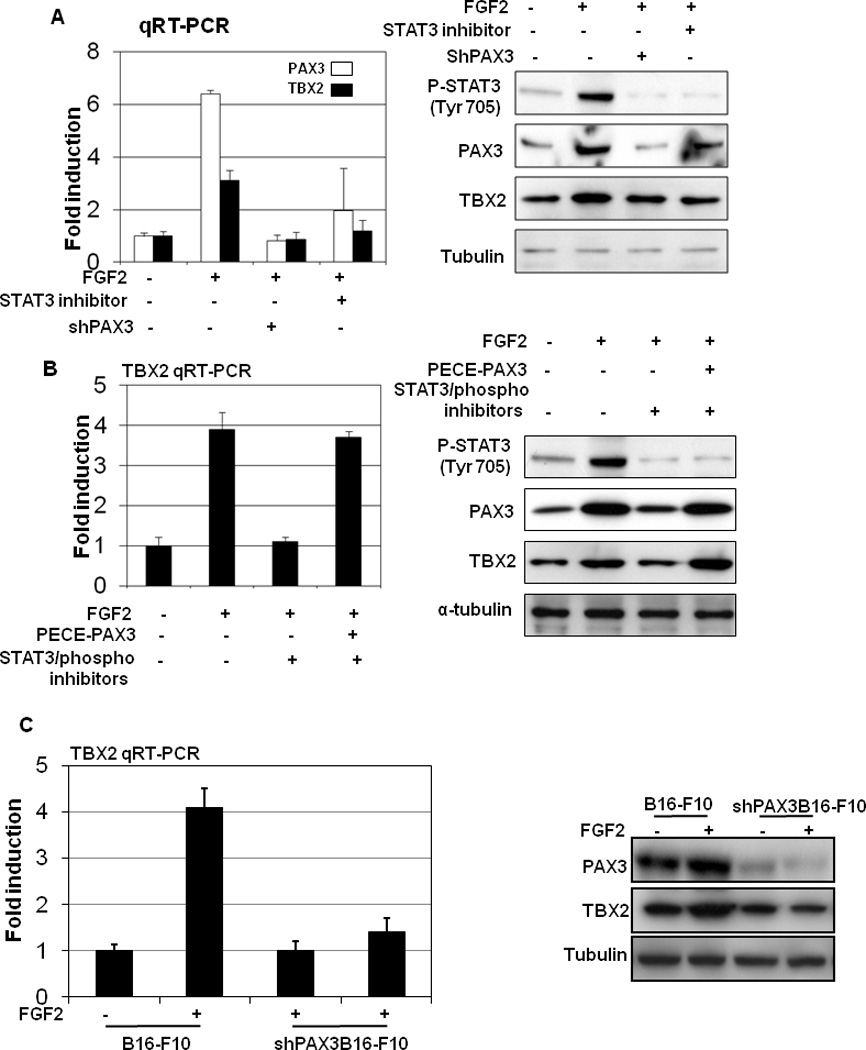
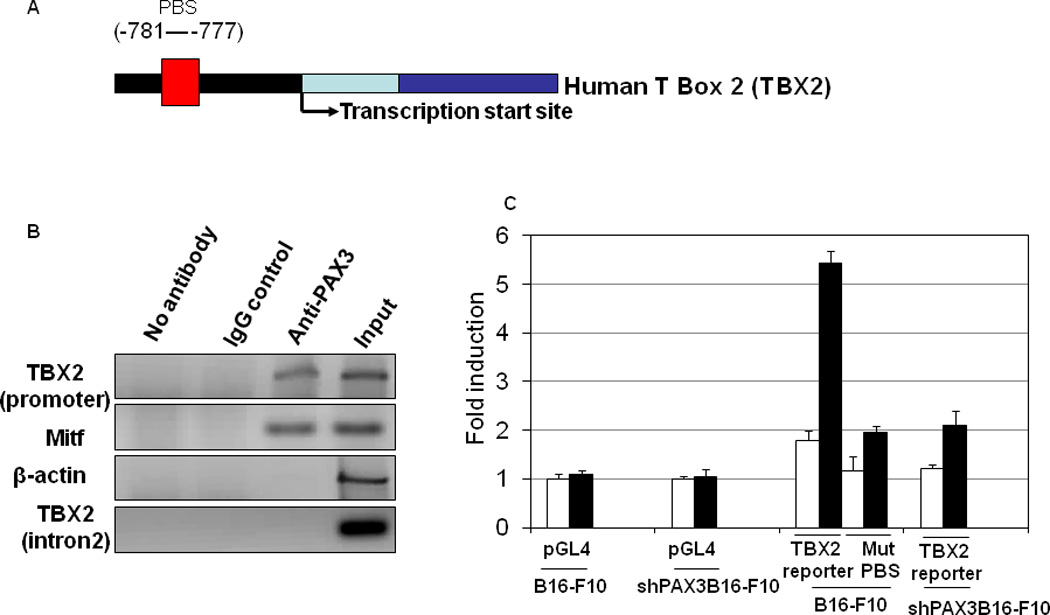
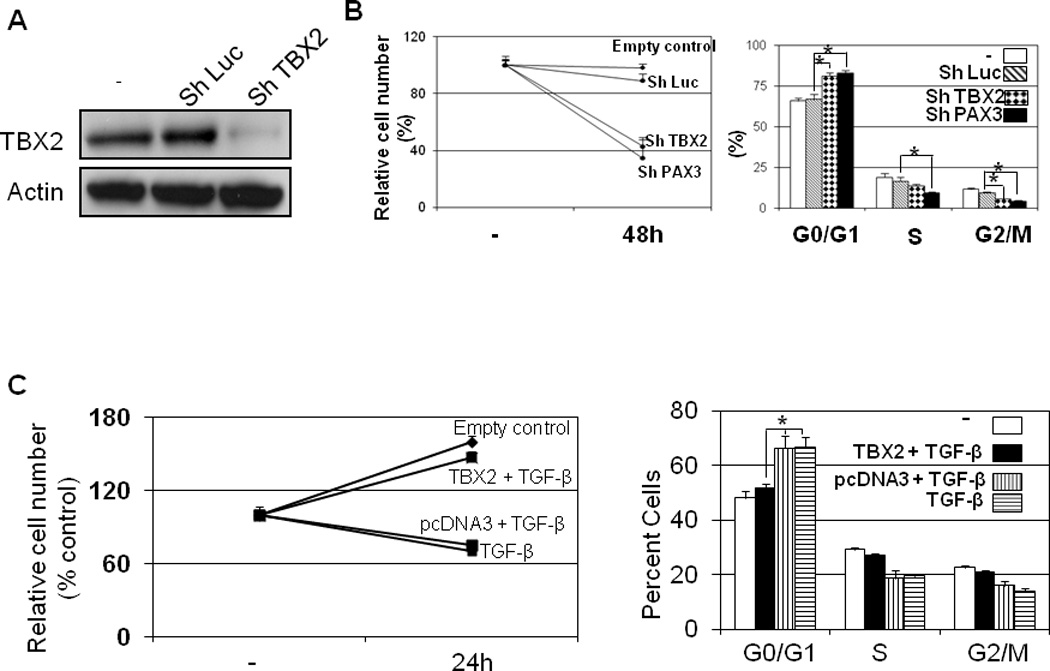
The paired box homeotic gene 3 (PAX3) is a crucial regulator for the maintenance of melanocytic progenitor cells and has a poorly defined role in melanoma. To understand how PAX3 affects melanocyte and melanoma proliferation, we identified potential PAX3 downstream targets through gene expression profiling. Here, we identify T-box 2 (TBX2), a key developmental regulator of cell identity and an antisenescence factor in melanoma, as a directly regulated PAX3 target. We also found that TBX2 is involved in the survival of melanoma cells and is overexpressed in some melanoma specimens. The identification of TBX2 as a target for PAX3 provides a key insight into how PAX3 may contribute to melanoma evolution and may provide opportunities for prosenescence therapeutic intervention aimed at disrupting the ability of PAX3 to regulate TBX2.


Conflict of interest statement

No potential conflicts of interest were disclosed.

Figures

Figure1
Figure1. Microarray screen for PAX3-dependent target genes
(A) Expression of virus-encoded proteins in primary human melanocytes infected for 48 hr with empty control (−), negative (GFP), wild-type (wt), or shRNA (shPAX3) PAX3 virus. (B) Summary of screen results from expression profiling of melanocytes overexpressed with PAX3 or knockdown PAX3 ± cycloheximide (CHX).
Figure2
Figure2. Correlation between TBX2 expression and PAX3 expression in melanomas
(A) TBX2 protein and PAX3 protein are co-localized in melanocyte nuclei. Melanoma cells were stained with anti-PAX3 and anti-TBX2 antibodies by Immunofluorescence. (B) Different H score of TBX2 and PAX3 staining of melanoma specimens. (C) Summary of TBX2 and PAX3 immunohistochemical staining in melanoma tissue array slices.
Figure3
Figure3. TBX2 is induced by PAX3 overexpression
(A) TBX2 antibody validation. TBX2 expression was determined in B16, A375 and melc cells by Western blot using Abcam rabbit polyclonal TBX2 antibodies. (B) B16 melanoma cells were transfected with empty pECE plasmid, pECE-PAX3 plasmid, or no plasmid. TBX2 RNA levels were measured by quantitative RT-PCR and normalized to GAPDH (left panel). Results are expressed as the mean of the experiment done in triplicate ± the SEM. TBX2 and PAX3 protein expression were analyzed by Western blot and α-tubulin was used as a loading control (right panel).
Figure4
Figure4. TBX2 is a PAX3 responsive gene
(A) Human primary melanocytes (HPMs) at 75% of confluency were stimulated with FGF2 (10nmol/L). RNA and protein were collected at time 0 and at different time points after stimulation. The left panels represent TBX2 RNA levels as measured by quantitative RT-PCR and normalized to GAPDH. Results are expressed as the mean of the experiment done in triplicate ± SEM. Induction is calculated relative to TBX2 levels in vehicle-treated cells. Protein levels of TBX2, which were analyzed by Western blot, are shown on the right, along with α-tubulin, which served as loading control. (B) Overexpression of PAX3 rescues STAT3 inhibitor inhibited FGF2-induced TBX2 upregulation. B16 melanoma cells were transfected with pECE-PAX3 plasmid for 24 hr and then treated with a specific STAT3 inhibitor, 5, 15-DPP (20umol/L), and a STAT3 phosphorate inhibitor, FLLL31 (5umol/L), together with FGF2 (10nmol/L) for 6 hr. TBX2 RNA levels were measured by quantitative RT-PCR and normalized to GAPDH (left panel). Results are expressed as the mean of the experiment done in triplicate ± the SEM. TBX2 and PAX3 protein expression were analyzed by Western blot, and α-tubulin was used as a loading control (right panel). (C) PAX3 is required in FGF2-stimulated TBX2 repression. B16 cells with stable siPAX3 were treatment with FGF2 (10nmol/L). RNA and protein were collected 6 hr following FGF2 stimulation. The left panels represent TBX2 RNA levels as measured by quantitative RT-PCR and normalized to GAPDH. Results are expressed as the mean of the experiment done in triplicate ± the standard error of the mean (SEM). Repression is calculated relative to TBX2 levels in vehicle (DMSO)-treated cells. Protein levels of TBX2 were analyzed by Western blot.
Figure5
Figure5. In vivo association of PAX3 with the TBX2 promoter by chromatin immunoprecipitation (ChIP)
(A) Schematic representation of the human TBX2 locus. (B) B16 melanoma cells were subjected to ChIP assays with the indicated antibodies and PCR primers. (C) Promoter activity was studied using reporter assays with different promoter portions (including mutated PD), which drive expression of firefly luciferase. Relative luciferase activity was normalized to empty pGL4-basic plasmid using the dual-luciferase assay system (Promega). Results are expressed as the mean of the experiment done in triplicate ± SEM. Analysis of TBX2 promoter transactivation capacity by FGF2 stimulation of B16 cells or B16 cells with stable shPAX3 transiently transfected with TBX2 reporter, employed mutations at PAX3 binding sites (PBS).
Figure6
Figure6. TBX2 contributes to the melanoma cell survival
(A) Knockdown of TBX2 in B16 cells. (B) Knockdown of TBX2 induced cell cycle arrest and the inhibition of proliferation B16 melanoma cells were transfected with ShTBX2 or control vector. After 48 hr, cells were fixed. Samples were subjected to MTT assays to evaluate the relative cell numbers (left panel) and to flow cytometry assays to determine the cell-cycle distribution (right panel). (*P<0.01 by t test). (B) Overexpression of TBX2 rescued the TGF-β-induced growth inhibition. B16 mouse melanoma cells were transfected with TBX2 vector and then treated with TGF-β 24 hr later. Samples were subjected to MTT assays to evaluate the relative cell numbers (left panel) and to flow cytometry assays to determine the cell-cycle distribution (right panel) 24 hr after TGF-β treatment.

References

    1. Blake JA, Ziman MR. Dev Growth Differ. 2005 Dec;47:627. - PubMed
    1. Steingrimsson E, Copeland NG, Jenkins NA. Cell. 2005 Apr 8;121:9. - PubMed
    1. Scholl FA, et al. Cancer Res. 2001 Feb 1;61:823. - PubMed
    1. Tassabehji M, et al. Hum Mol Genet. 1994 Jul;3:1069. - PubMed
    1. Moase CE, Trasler DG. J Med Genet. 1992 Mar;29:145. - PMC - PubMed

Publication types

MeSH terms