. 2012 Sep 28;151(1):80-95.
doi: 10.1016/j.cell.2012.08.018.

Protein modularity, cooperative binding, and hybrid regulatory states underlie transcriptional network diversification

Affiliations

Protein modularity, cooperative binding, and hybrid regulatory states underlie transcriptional network diversification

Christopher R Baker et al. Cell. .

Abstract

We examine how different transcriptional network structures can evolve from an ancestral network. By characterizing how the ancestral mode of gene regulation for genes specific to a-type cells in yeast species evolved from an activating paradigm to a repressing one, we show that regulatory protein modularity, conversion of one cis-regulatory sequence to another, distribution of binding energy among protein-protein and protein-DNA interactions, and exploitation of ancestral network features all contribute to the evolution of a novel regulatory mode. The formation of this derived mode of regulation did not disrupt the ancestral mode and thereby created a hybrid regulatory state where both means of transcription regulation (ancestral and derived) contribute to the conserved expression pattern of the network. Finally, we show how this hybrid regulatory state has resolved in different ways in different lineages to generate the diversity of regulatory network structures observed in modern species.


Conflict of interest statement

The authors declare no conflict of interest.

Figures
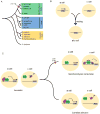
Figure 1
Figure 1. Cell-type specification in the hemiascomycetes
(A) Three hemiascomycete clades are considered—Candida, Kluyveromyces and Saccharomyces. The Saccharmoyces clade includes the pre-whole genome duplication species Zygosaccharomyces rouxii and the post-whole genome duplication species that lack an a2 gene (loss event indicated by a pink X). (B) The hemiascomycete yeasts have three cell types; the mating competent a and α cells and the product of their mating, an a/α cell. a cells express a set of genes called the asgs (asgs) (Herskowitz, 1989). (C) In C. albicans and the ancestor, the asgs are activated by Mcm1 (present in all cell types) and a2 (present only in a-cells) (Tsong et al., 2003). In S. cerevisiae, the asgs are specified using Mcm1 a cell-type specific repressor, α2 (Johnson and Herskowitz, 1985; Keleher et al., 1988).
Figure 2
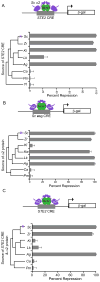
Figure 2. α2 repression of the asgs evolved prior to the divergence of Saccharomyces and Kluyveromyces
(A) The asg cis-regulatory sequence of the α-pheromone receptor gene STE2 from S. cerevisiae (Sc) and species that branch prior to the loss of the a2 gene, Z. rouxii (Zr), K. lactis (Kl), L. kluyveri (Lk), A. gossypii (Ag), C. albicans (Ca), P. membranificians (Pm), and Y. lipolytica (Yl) were inserted into a reporter construct to assay repression. Percent repression was determined by transforming constructs into S. cerevisiae a-cells (no α2) and α-cells (α2 present). (B) α2 protein coding sequence from a variety of hemiascomycete species including K. wickerhamii (Kw) were fused to the endogenous S. cerevisiae α2 promoter and integrated into the genome of a S. cerevisiae MATΔ strain. “Trans-species” α2 proteins were then assayed for their ability to repress the S. cerevisiae STE2 asg reporter. (C) Trans-species α2 proteins were combined with the STE2 cis-regulatory sequence reporter constructs from the same species and assayed for repression in a MATΔ background. All values reported are a mean (n=3) and standard error of the mean.
Figure 3
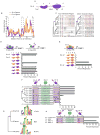
Figure 3. The cis and trans-evolution underlying the gain of a new function for α2
(A) Structured regions of S. cerevisiae α2 are displayed as globular, whereas, unstructured regions are displayed as curved lines. (B) Conservation scores for the α2 protein across the Saccharomyces-Kluyveromyces group (Sc) or the Candida-group (Ca). The vertical dashed lines correspond to the edges of the modular regions within the α2 protein. The positions of the three structurally predicted helices within regions 2 and 4 are marked (*) (C) The MUSCLE alignment for regions 1 and 3 are displayed. (D) S. cerevisiae α2 modules were swapped for the homologous regions from the C. albicans α2 protein. Each construct was genome-integrated in a MATΔ background and assayed for the ability to repress the S. cerevisiae STE2 asg (Sc asg) and STE4 haploid specific gene (Sc hsg) reporter constructs. (E) S. cerevisiae α2 regions 1 and 3 were swapped for the aligning sequence in the C. albicans a2 protein, genome-integrated in a MATΔ background, and assayed for repression of the Sc asg reporter construct. (F) An array of asg cis-regulatory sequences were selected from the Kluyveromyces and Candida clades based on their distribution across a range of similarity values to the S. cerevisiae asg PSSM (Table S3). Purple shading indicates where α2 binds in S. cerevisiae and green shading indicates where Mcm1 binds. Yellow text highlights nucleotides that appear in the consensus binding-sites for S. cerevisiae α2. (G) PSSM for α2 alone site, a2/α2 site, and a2 site alone. (H) The C. albicans RAM2 was mutated at key residues for α2 binding and tested for their ability to support repression. All values reported in bar graphs are a mean (n=3) and standard error of the mean. In each phylogenetic tree, the purple circle marks the gain of α2-mediated repression of asgs and the pink X marks the loss of a2.
Figure 4
Figure 4. The contribution of non-specific protein interactions to early intermediates
(A) Wild-type S. cerevisiae α2 (WT) or mutant S. cerevisiae α2 with its Mcm1 interaction region replaced by the aligning sequence from C. albicans (ΔMcm1 int.) were tested for the ability to repress the S. cerevisiae STE2 (Scer) or C. albicans RAM2 (Calb) asg reporter. The α2 proteins were tested either at the endogenous level, using a strong promoter (TEF1), or using a very strong promoter (TDH3). (B) Both α2 constructs from (A) were tested for the ability to repress a modified S. cerevisiae STE2 asg cis-regulatory reporter construct where the Mcm1 binding site was compromised (ΔMcm1 site). (C) Both α2 constructs from (A) were tested for the ability to repress a modified S. cerevisiae STE2 asg cis-regulatory reporter construct where the α2 binding site was compromised (Δα2 site). In all panels, the purple and green shading represents the binding site of α2 and Mcm1, respectively. All values reported in bar graphs are a mean (n=3) and standard error of the mean.
Figure 5
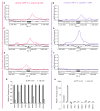
Figure 5. Regulation of the asgs in Lachancea kluyveri
(A–F) ChIP-chip was performed using anti-cMyc antibodies in a C-terminal myc-tagged MATa2 a cells (A, C, and E solid, pink lines), wild-type a cells (A, C, and E dotted, pink lines), C-terminal myc-tagged MATα2 α cells (B, D, and F solid, purple lines) or wild-type α cells (B, D, and F dotted, purple lines). Wild-type cells serve as untagged controls. ChIP-chip enrichment profiles are shown for AGA1 (A and B), AGA2 (C and D) and STE2 (E and F). Genes (grey rectangles) are displayed below the line if transcribed to the left and above the line if transcribed to the right. (G, H) The transcript levels of the asgs in a wild-type or ΔMATa2 a cell (G) and in a wild-type or ΔMATα2 α cell (H) were measured relative to ACT1 by RT-qPCR. The relative transcript abundance for each gene was normalized to the abundance in wild-type a cells (G) or in wild-type α cells (H). Displayed is the mean (n=3) and standard error of the mean.
Figure 6
Figure 6. Regulation of the asgs in Kluyveromyces lactis
(A–D) ChIP-chip was performed using anti-cMyc antibodies in a C-terminal myc-tagged MATa2 a cells (A and C solid, pink lines), wild-type a cells (A and C dotted, pink lines), C-terminal myc-tagged MATα2 α cells (B and D solid, purple lines) or wild-type α cells (B and D dotted, purple lines). Wild-type cells serve as untagged controls. For ChIP performed in a cells (A and C), two conditions were used: one with pheromone induction (dark pink) and one without (light pink). ChIP-chip enrichment profiles are shown for STE2 (A and B), and STE6 (C and D). Genes (grey rectangles) are displayed below the line if transcribed to the left and above the line if transcribed to the right. (E) Results for orthologs of the asgs from an expression array comparing mRNA levels from ΔMATa2 a cells to wild-type a cells (two left columns) or mRNA levels from ΔMATα2 α cells to wild-type α cells (two right columns). (F, G) The K. lactis α2 protein was assayed for its ability to repress a S. cerevisiae STE2 operator sequence using a β-gal reporter. (F) Wild-type K. lactis α2 was expressed in a S. cerevisiae MATΔ cell using promoters of increasing strength. (G) Wild-type K. lactis α2 or K. lactis α2 with a single point mutation (N136V) was expressed in a S. cerevisiae MATΔ cell using the endogenous S. cerevisiae α2 promoter. Displayed are the mean (n=3) and standard error of the mean.
Figure 7
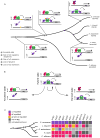
Figure 7. The gain of the hybrid regulatory state facilitated diversification of asg regulation
(A) The evolutionary trajectory of the gain of repression by α2 is shown for a representative asg. Major evolutionary events are indicated by numbered, grey circles. Gains, either in cis or trans are indicated by yellow stars and losses by a black “x”. The regulatory state of the extant yeast are shown (ancestral indicates a2 activation only, derived indicates α2 repression only and hybrid indicates both modes of regulation). (B) The hybrid intermediate can “resolve” in different ways. It can revert to the ancestral mode of regulation through loss of the derived mode (left arrow; K. lactis), maintain the hybrid in some fashion (circular, center arrow; K. wickerhamii and L. kluyveri), or lose the ancestral mode of regulation (right arrow; S. cerevisiae). (C) Individual genes are regulated differently between and within species. On the left is a recapitulation of part A of this figure. asgs are listed by the S. cerevisiae orthologs on the top of the figure and their mode of regulation (if available) are indicated for each species by a colored square (see key in figure).

References

    1. Bailey TL, Boden M, Buske FA, Frith M, Grant CE, Clementi L, Ren J, Li WW, Noble WS. MEME SUITE: tools for motif discovery and searching. Nucleic Acids Research. 2009;37:W202–208. - PMC - PubMed
    1. Booth LN, Tuch BB, Johnson AD. Intercalation of a new tier of transcription regulation into an ancient circuit. Nature. 2010;468:959–963. - PMC - PubMed
    1. Butler G, Kenny C, Fagan A, Kurischko C, Gaillardin C, Wolfe KH. Evolution of the MAT locus and its Ho endonuclease in yeast species. Proc Natl Acad Sci USA. 2004;101:1632–1637. - PMC - PubMed
    1. Carroll SB. Evolution at two levels: on genes and form. PLoS Biol. 2005;3:e245. - PMC - PubMed
    1. Chan YF, Marks ME, Jones FC, Villarreal G, Shapiro MD, Brady SD, Southwick AM, Absher DM, Grimwood J, Schmutz J, et al. Adaptive evolution of pelvic reduction in sticklebacks by recurrent deletion of a Pitx1 enhancer. Science. 2010;327:302–305. - PMC - PubMed

Publication types

MeSH terms

Associated data