Review
. 2012 Sep 29;14(1):68.
doi: 10.1186/1532-429X-14-68.

CMR of microvascular obstruction and hemorrhage in myocardial infarction

Affiliations
Review

CMR of microvascular obstruction and hemorrhage in myocardial infarction

Katherine C Wu. J Cardiovasc Magn Reson. .

Abstract

Microvascular obstruction (MO) or no-reflow phenomenon is an established complication of coronary reperfusion therapy for acute myocardial infarction. It is increasingly recognized as a poor prognostic indicator and marker of subsequent adverse LV remodeling. Although MO can be assessed using various imaging modalities including electrocardiography, myocardial contrast echocardiography, nuclear scintigraphy, and coronary angiography, evaluation by cardiovascular magnetic resonance (CMR) is particularly useful in enhancing its detection, diagnosis, and quantification, as well as following its subsequent effects on infarct evolution and healing. MO assessment has become a routine component of the CMR evaluation of acute myocardial infarction and will increasingly play a role in clinical trials of adjunctive reperfusion agents and strategies. This review will summarize the pathophysiology of MO, current CMR approaches to diagnosis, clinical implications, and future directions needed for improving our understanding of this common clinical problem.


Figures

Figure 1
Figure 1
Shown is an example of anatomic no-reflow detected by vital staining in an experimental rabbit model of coronary occlusion and reperfusion. In Panel A, 4 short-axis slices are shown depicting the regions perfused and stained by monastral blue, which was injected during coronary occlusion. Regions which were not perfused by the dye (i.e. do not stain blue) represent the risk area. In Panel B, the slices were imaged under UV light to depict the fluorescent areas (greenish color) stained by thioflavin-S, which was injected following reperfusion and stains intact endothelium. The thioflavin-S negative regions represent no-reflow,are contained within and are smaller than the risk region. Hence, thioflavin-S negative areas depict regions of obstruction to flow despite reperfusion . Reprinted with permission from Reffelmann T, Kloner R A Heart 2002;87:163 [2].
Figure 2
Figure 2
Schematic depicting the multiple mechanisms that contribute to the no-reflow phenomenon at the ultrastructural level. Reprinted with permission from Reffelmann T, Kloner R A Heart 2002;87:164 [2].
Figure 3
Figure 3
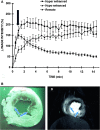
A shows the signal intensity curves following gadolinium bolus administration in infarct regions which become hyperenhanced compared to the persistent hypoenhancement within the infarct core. Historically, hypoenhancement was measured at ~1 min (black arrow) following contrast administration. Reprinted from Judd, RM et al. Circulation 1995;92:1902–10 [5]. B shows the correlation between MO detected by thioflavin-S (left panel) compared to CMR (right panel). Reprinted from Rochitte C E et al. Circulation 1998;98:1006–1014 [14].
Figure 4
Figure 4
MO regions depicted on first pass imaging CMR (top panel) which though smaller, persist on LGE images (bottom panel).
Figure 5
Figure 5
MO (arrow) within a lateral infarct shown using high-resolution k-t SENSE accelerated first pass imaging (left panel), EGE with fixed TI of 440 msec (middle panel), and LGE (right panel). Reprinted with permission from Mather et al. J Cardiovasc Magn Reson 2009;11(1):11–33 [21].
Figure 6
Figure 6
Shown are corresponding short-axis slices from a 62-year-old gentleman with anterior ST elevation MI who was treated with primary PCI. Using the kt-SENSE first-pass perfusion imaging technique on day 2 post MI with 0.1 mmol/kg intravenous gadolinium contrast, there is an area of persistent hypoperfusion corresponding to MO. There is substantial improvement at re-imaging on day 7 (Panel b). (Image provided courtesy of Ananth Kidambi, BMBCh; Adam N. Mather, MBBS; and Sven Plein, MD, PhD; Multidisciplinary Cardiovascular Research Centre & Leeds Institute of Genetics, Health, and Therapeutics, University of Leeds, Leeds, United Kingdom.).
Figure 7
Figure 7
The effect of MO on adverse LV remodeling is shown in a patient. CMR-LGE and cine images are shown acutely post-infarction (Panels A & B) and at 9 month follow-up post-infarction (Panels C & D). Despite successful epicardial reperfusion of the left anterior descending coronary artery, there was a large region of persistent MO associated with a large anteroapical infarct measuring 49% of the LV (Panel A). Acutely (Panel B), LVEF measured 27% and LV volumes were enlarged with LV end-diastolic volume (LVEDV) of 192 ml and end-systolic (LVESV) of 141 ml. At 9 month follow-up, there was LV apical aneurysm formation with infarct wall thinning (Panel C) with a persistently reduced LVEF of 25% and further enlargement of the LV with LVEDV of 291 ml and LVESV of 218 ml (Panel D).
Figure 8
Figure 8
The presence and persistence of MO can predict how well the LV remodels in the subsequent year. Reprinted with permission from: Ørn S et al. Eur Heart J 2009;30:1978–1985 [30].
Figure 9
Figure 9
Gross anatomic features (Panels A & C) of a bland, white non-reperfused (Panel A, white arrows) and a hemorrhagic, red reperfused (Panel C, arrows) acute MI. Coronary cross sections (Panels B &D) revealed an occlusive thrombus (Panel B, black arrow) in the left anterior descending artery (LAD) of the bland infarct while the hemorrhage infarct was associated with recanalization of the LAD (Panel D, black arrow) with residual mural thrombus (Panel D, orange arrowheads). Reprinted with permission from Basso C, Thiene G. Heart 2006;92:1559–1562 [62] (Original image provided courtesy of Professor Cristina Basso, Department of Medical Diagnostic Sciences and Special Therapies, University of Padua Medical School, Padova, Italy.).
Figure 10
Figure 10
Shown are short axis images from a 48-year-old gentleman who presented with inferior ST-elevation and received primary percutaneous intervention to the RCA. CMR on day 2 post MI demonstrated an area of hypointense signal on T2-weighted imaging (Panel a), but no signal hypointensity on T2* imaging (Panel b). This area was confirmed to represent MO on early gadolinium imaging (Panel c). Intramyocardial hemorrhage results in decreased signal intensity on T2* imaging, and the absence of this feature reflects a lack of visible hemorrhage within the area of MO. (Image provided courtesy of Ananth Kidambi, BMBCh; Adam N. Mather, MBBS; and Sven Plein, MD, PhD; Multidisciplinary Cardiovascular Research Centre & Leeds Institute of Genetics, Health, and Therapeutics, University of Leeds, Leeds, United Kingdom.).
Figure 11
Figure 11
T2-weighted short tau inversion recovery (STIR), T2 map and late gadolinium enhancement (LGE) images – all obtained in a similar mid-short axis plane – are shown from CMR examination performed in a 53 year-old male who suffered ST-elevation myocardial infarction. CMR performed 1 day following percutaneous coronary revascularization of a large obtuse marginal coronary artery yielded a calculated LVEF of 55%. STIR imaging suggested increased signal intensity in the inferolateral wall (arc), but does not demonstrate an abnormality within this region. Quantitative T2 mapping shows a region of increased T2 with a hypointense core indicating microvascular obstruction (MO). Mean T2 values in the edematous region (dotted line), MO (black arrow) and remote myocardium (solid circle) were 71, 59 and 48 msecs. 10 min after intravenous gadolinium-based contrast administration, LGE confirms a region of MO in this post-STEMI patient. (Image provided courtesy of Subha V. Raman, MD, MSEE; Davis Heart and Lung Research Institute, The Ohio State University, Columbus, Ohio.).
Figure 12
Figure 12
The potential for T2* imaging to improve the differentiation between MO with and without hemorrhage is shown. Panel A shows uniform hyperintensity on T2-SPIR (spectrally selective inversion recovery) imaging despite a region of persistent MO on LGE (Panel C). In Panel B, a small region of decreased T2* is shown, which is much smaller than the MO region, suggesting that much of MO region is in fact non-hemorrhagic and shows normal T2* values. (Reprinted with permission from: O’Regan DP et al. Heart 2010; 96:1885-1891 [78]). See also the imaging vignette from Cannan C et al. JACC: Cardiovascular Imaging 2010; 3(6):665–668 [71].

References

    1. Kloner RA, Ganote CE, Jennings RB. The "no-reflow" phenomenon after temporary coronary occlusion in the dog. J Clin Invest. 1974;54:1496–508. doi: 10.1172/JCI107898. - DOI - PMC - PubMed
    1. Reffelmann T, Kloner RA. The "no-reflow" phenomenon: basic science and clinical correlates. Heart. 2002;87:162–8. doi: 10.1136/heart.87.2.162. - DOI - PMC - PubMed
    1. Reffelmann T, Kloner RA. The no-reflow phenomenon: a basic mechanism of myocardial ischemia and reperfusion. Basic Res Cardiol. 2006;101:359–72. doi: 10.1007/s00395-006-0615-2. - DOI - PubMed
    1. Ambrosio G, Weisman HF, Mannisi JA, Becker LC. Progressive impairment of regional myocardial perfusion after initial restoration of postischemic blood flow. Circulation. 1989;80:1846–61. doi: 10.1161/01.CIR.80.6.1846. - DOI - PubMed
    1. Judd RM, Lugo-Olivieri CH, Arai M, Kondo T, Croisille P, Lima JA, Mohan V, Becker LC, Zerhouni EA. Physiological basis of myocardial contrast enhancement in fast magnetic resonance images of 2-day-old reperfused canine infarcts. Circulation. 1995;92:1902–10. doi: 10.1161/01.CIR.92.7.1902. - DOI - PubMed

Publication types

MeSH terms