

Candidate gene association study in pediatric acute lymphoblastic leukemia evaluated by Bayesian network based Bayesian multilevel analysis of relevance
- PMID: 23021489
- PMCID: PMC3542204
- DOI: 10.1186/1755-8794-5-42
Candidate gene association study in pediatric acute lymphoblastic leukemia evaluated by Bayesian network based Bayesian multilevel analysis of relevance
Abstract
Background: We carried out a candidate gene association study in pediatric acute lymphoblastic leukemia (ALL) to identify possible genetic risk factors in a Hungarian population.
Methods: The results were evaluated with traditional statistical methods and with our newly developed Bayesian network based Bayesian multilevel analysis of relevance (BN-BMLA) method. We collected genomic DNA and clinical data from 543 children, who underwent chemotherapy due to ALL, and 529 healthy controls. Altogether 66 single nucleotide polymorphisms (SNPs) in 19 candidate genes were genotyped.
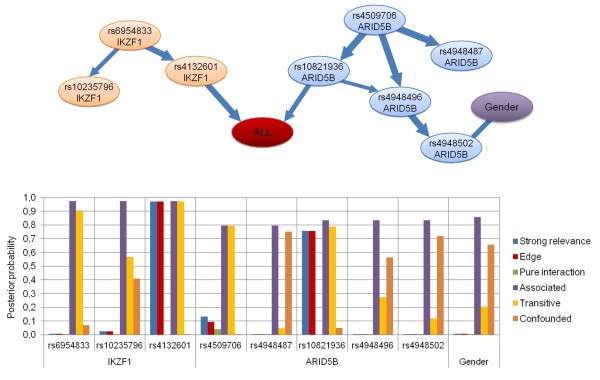
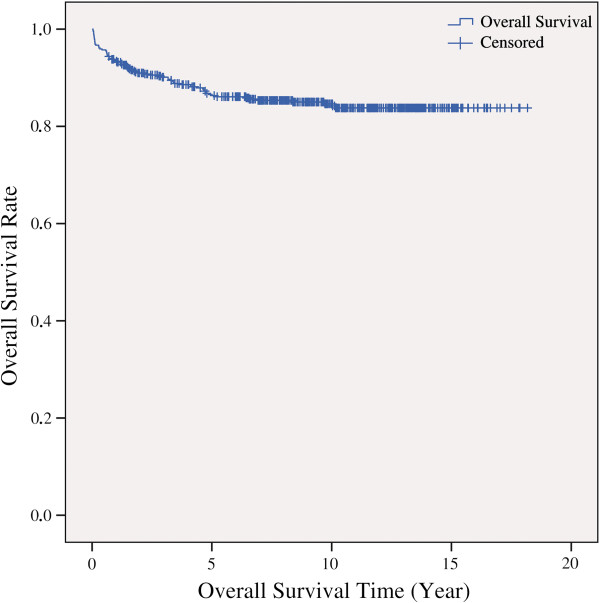
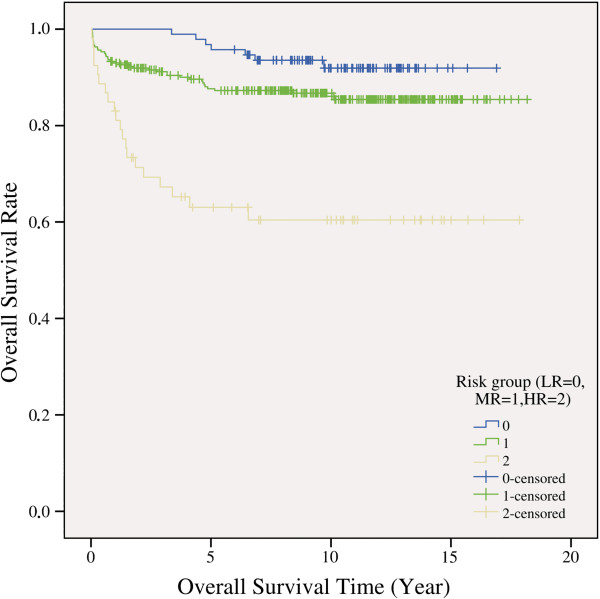
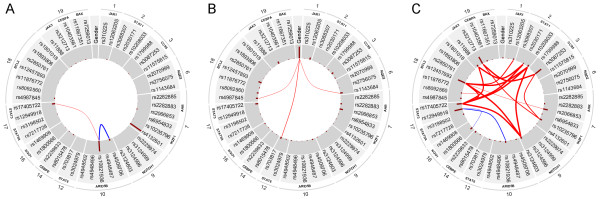
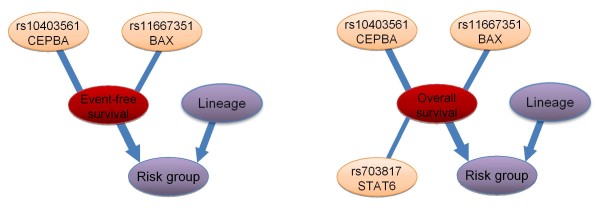
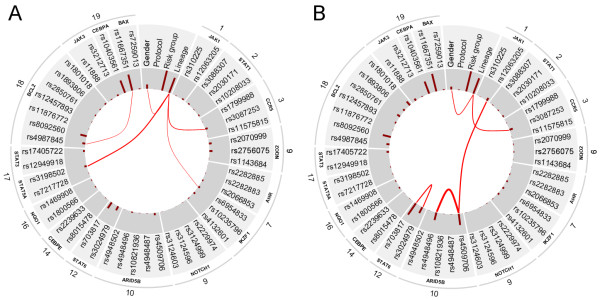
Results: With logistic regression, we identified 6 SNPs in the ARID5B and IKZF1 genes associated with increased risk to B-cell ALL, and two SNPs in the STAT3 gene, which decreased the risk to hyperdiploid ALL. Because the associated SNPs were in linkage in each gene, these associations corresponded to one signal per gene. The odds ratio (OR) associated with the tag SNPs were: OR = 1.69, P = 2.22x10(-7) for rs4132601 (IKZF1), OR = 1.53, P = 1.95x10(-5) for rs10821936 (ARID5B) and OR = 0.64, P = 2.32x10(-4) for rs12949918 (STAT3). With the BN-BMLA we confirmed the findings of the frequentist-based method and received additional information about the nature of the relations between the SNPs and the disease. E.g. the rs10821936 in ARID5B and rs17405722 in STAT3 showed a weak interaction, and in case of T-cell lineage sample group, the gender showed a weak interaction with three SNPs in three genes. In the hyperdiploid patient group the BN-BMLA detected a strong interaction among SNPs in the NOTCH1, STAT1, STAT3 and BCL2 genes. Evaluating the survival rate of the patients with ALL, the BN-BMLA showed that besides risk groups and subtypes, genetic variations in the BAX and CEBPA genes might also influence the probability of survival of the patients.
Conclusions: In the present study we confirmed the roles of genetic variations in ARID5B and IKZF1 in the susceptibility to B-cell ALL. With the newly developed BN-BMLA method several gene-gene, gene-phenotype and phenotype-phenotype connections were revealed. We showed several advantageous features of the new method, and suggested that in gene association studies the BN-BMLA might be a useful supplementary to the traditional frequentist-based statistical method.
Figures
References
-
- Sherborne AL, Hemminki K, Kumar R, Bartram CR, Stanulla M, Schrappe M, Petridou E, Semsei AF, Szalai C, Sinnett D. et al.Rationale for an international consortium to study inherited genetic susceptibility to childhood acute lymphoblastic leukemia. Haematologica. 2011;96(7):1049–1054. doi: 10.3324/haematol.2011.040121. - DOI - PMC - PubMed
-
- Papaemmanuil E, Hosking FJ, Vijayakrishnan J, Price A, Olver B, Sheridan E, Kinsey SE, Lightfoot T, Roman E, Irving JAE. et al.Loci on 7p12.2, 10q21.2 and 14q11.2 are associated with risk of childhood acute lymphoblastic leukemia. Nat Genet. 2009;41(9):1006–1010. doi: 10.1038/ng.430. - DOI - PMC - PubMed
-
- Semsei AF, Erdélyi DJ, Ungvári I, Kámory E, Csókay B, Andrikovics H, Tordai A, Cságoly E, Falus A, Kovács GT. et al.Association of some rare haplotypes and genotype combinations in the MDR1 gene with childhood acute lymphoblastic leukaemia. Leuk Res. 2008;32(8):1214–1220. doi: 10.1016/j.leukres.2007.12.009. - DOI - PubMed
Publication types
MeSH terms
LinkOut - more resources
Full Text Sources
Other Literature Sources
Research Materials
Miscellaneous
